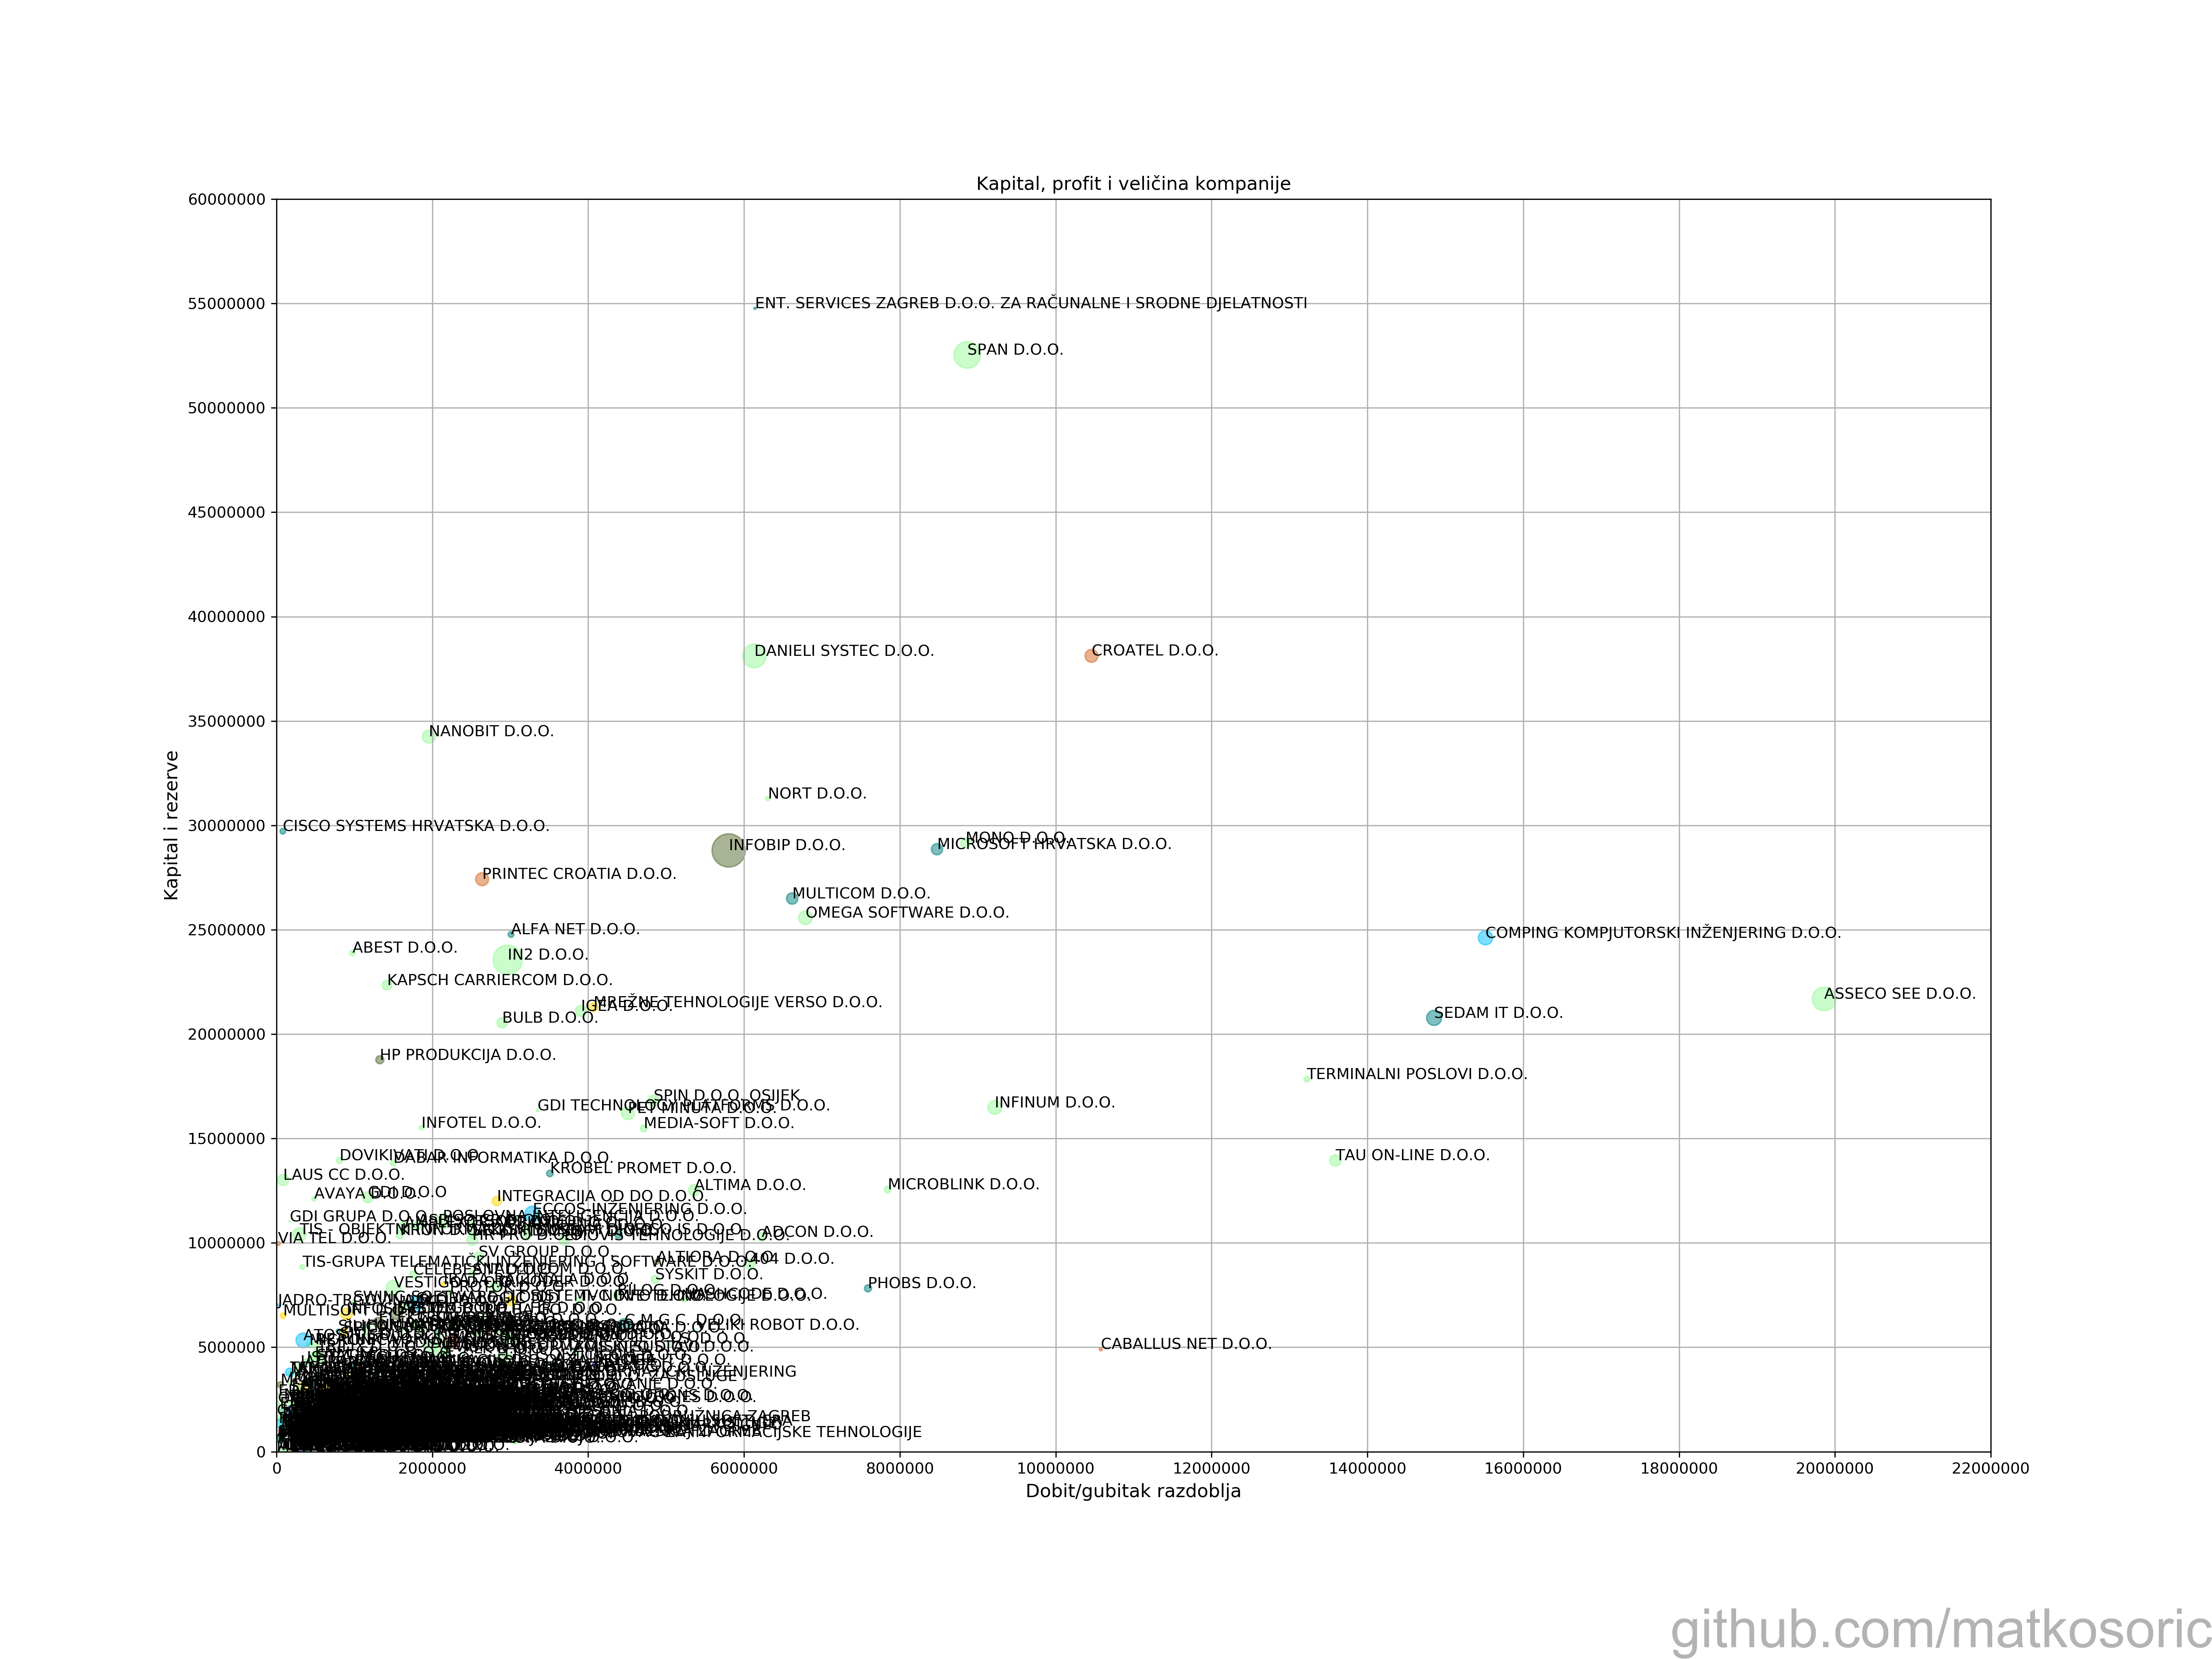
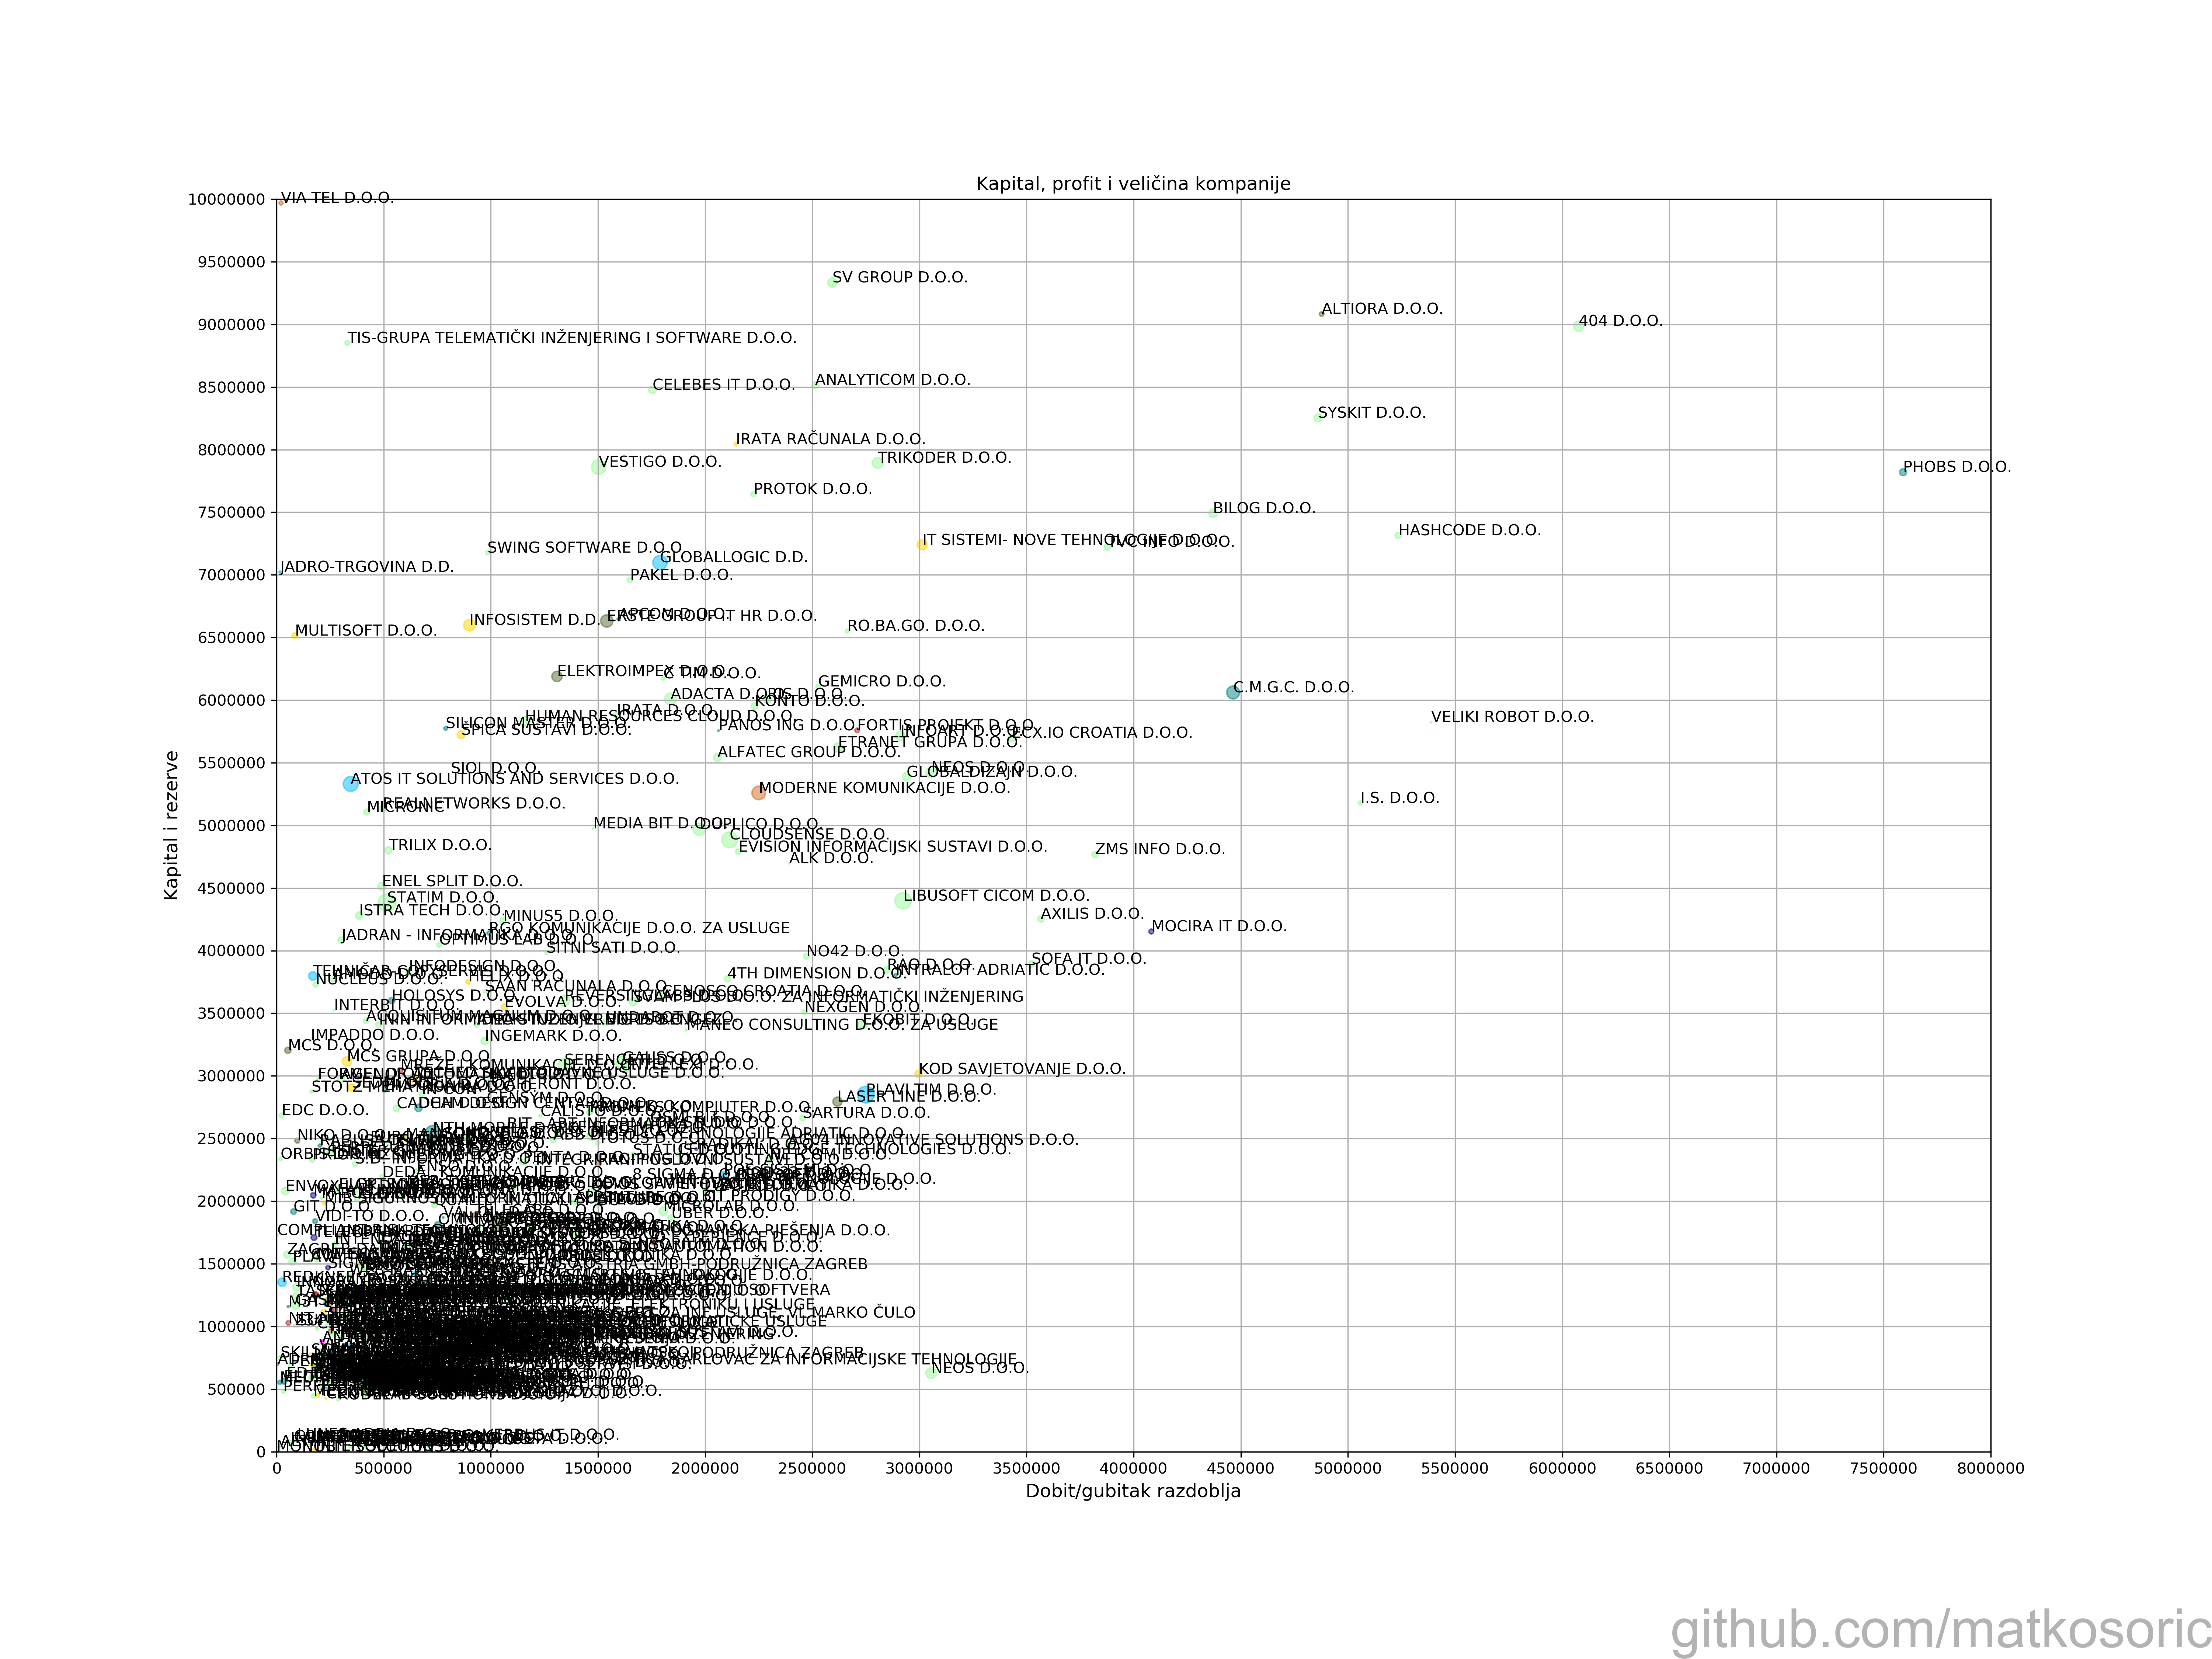
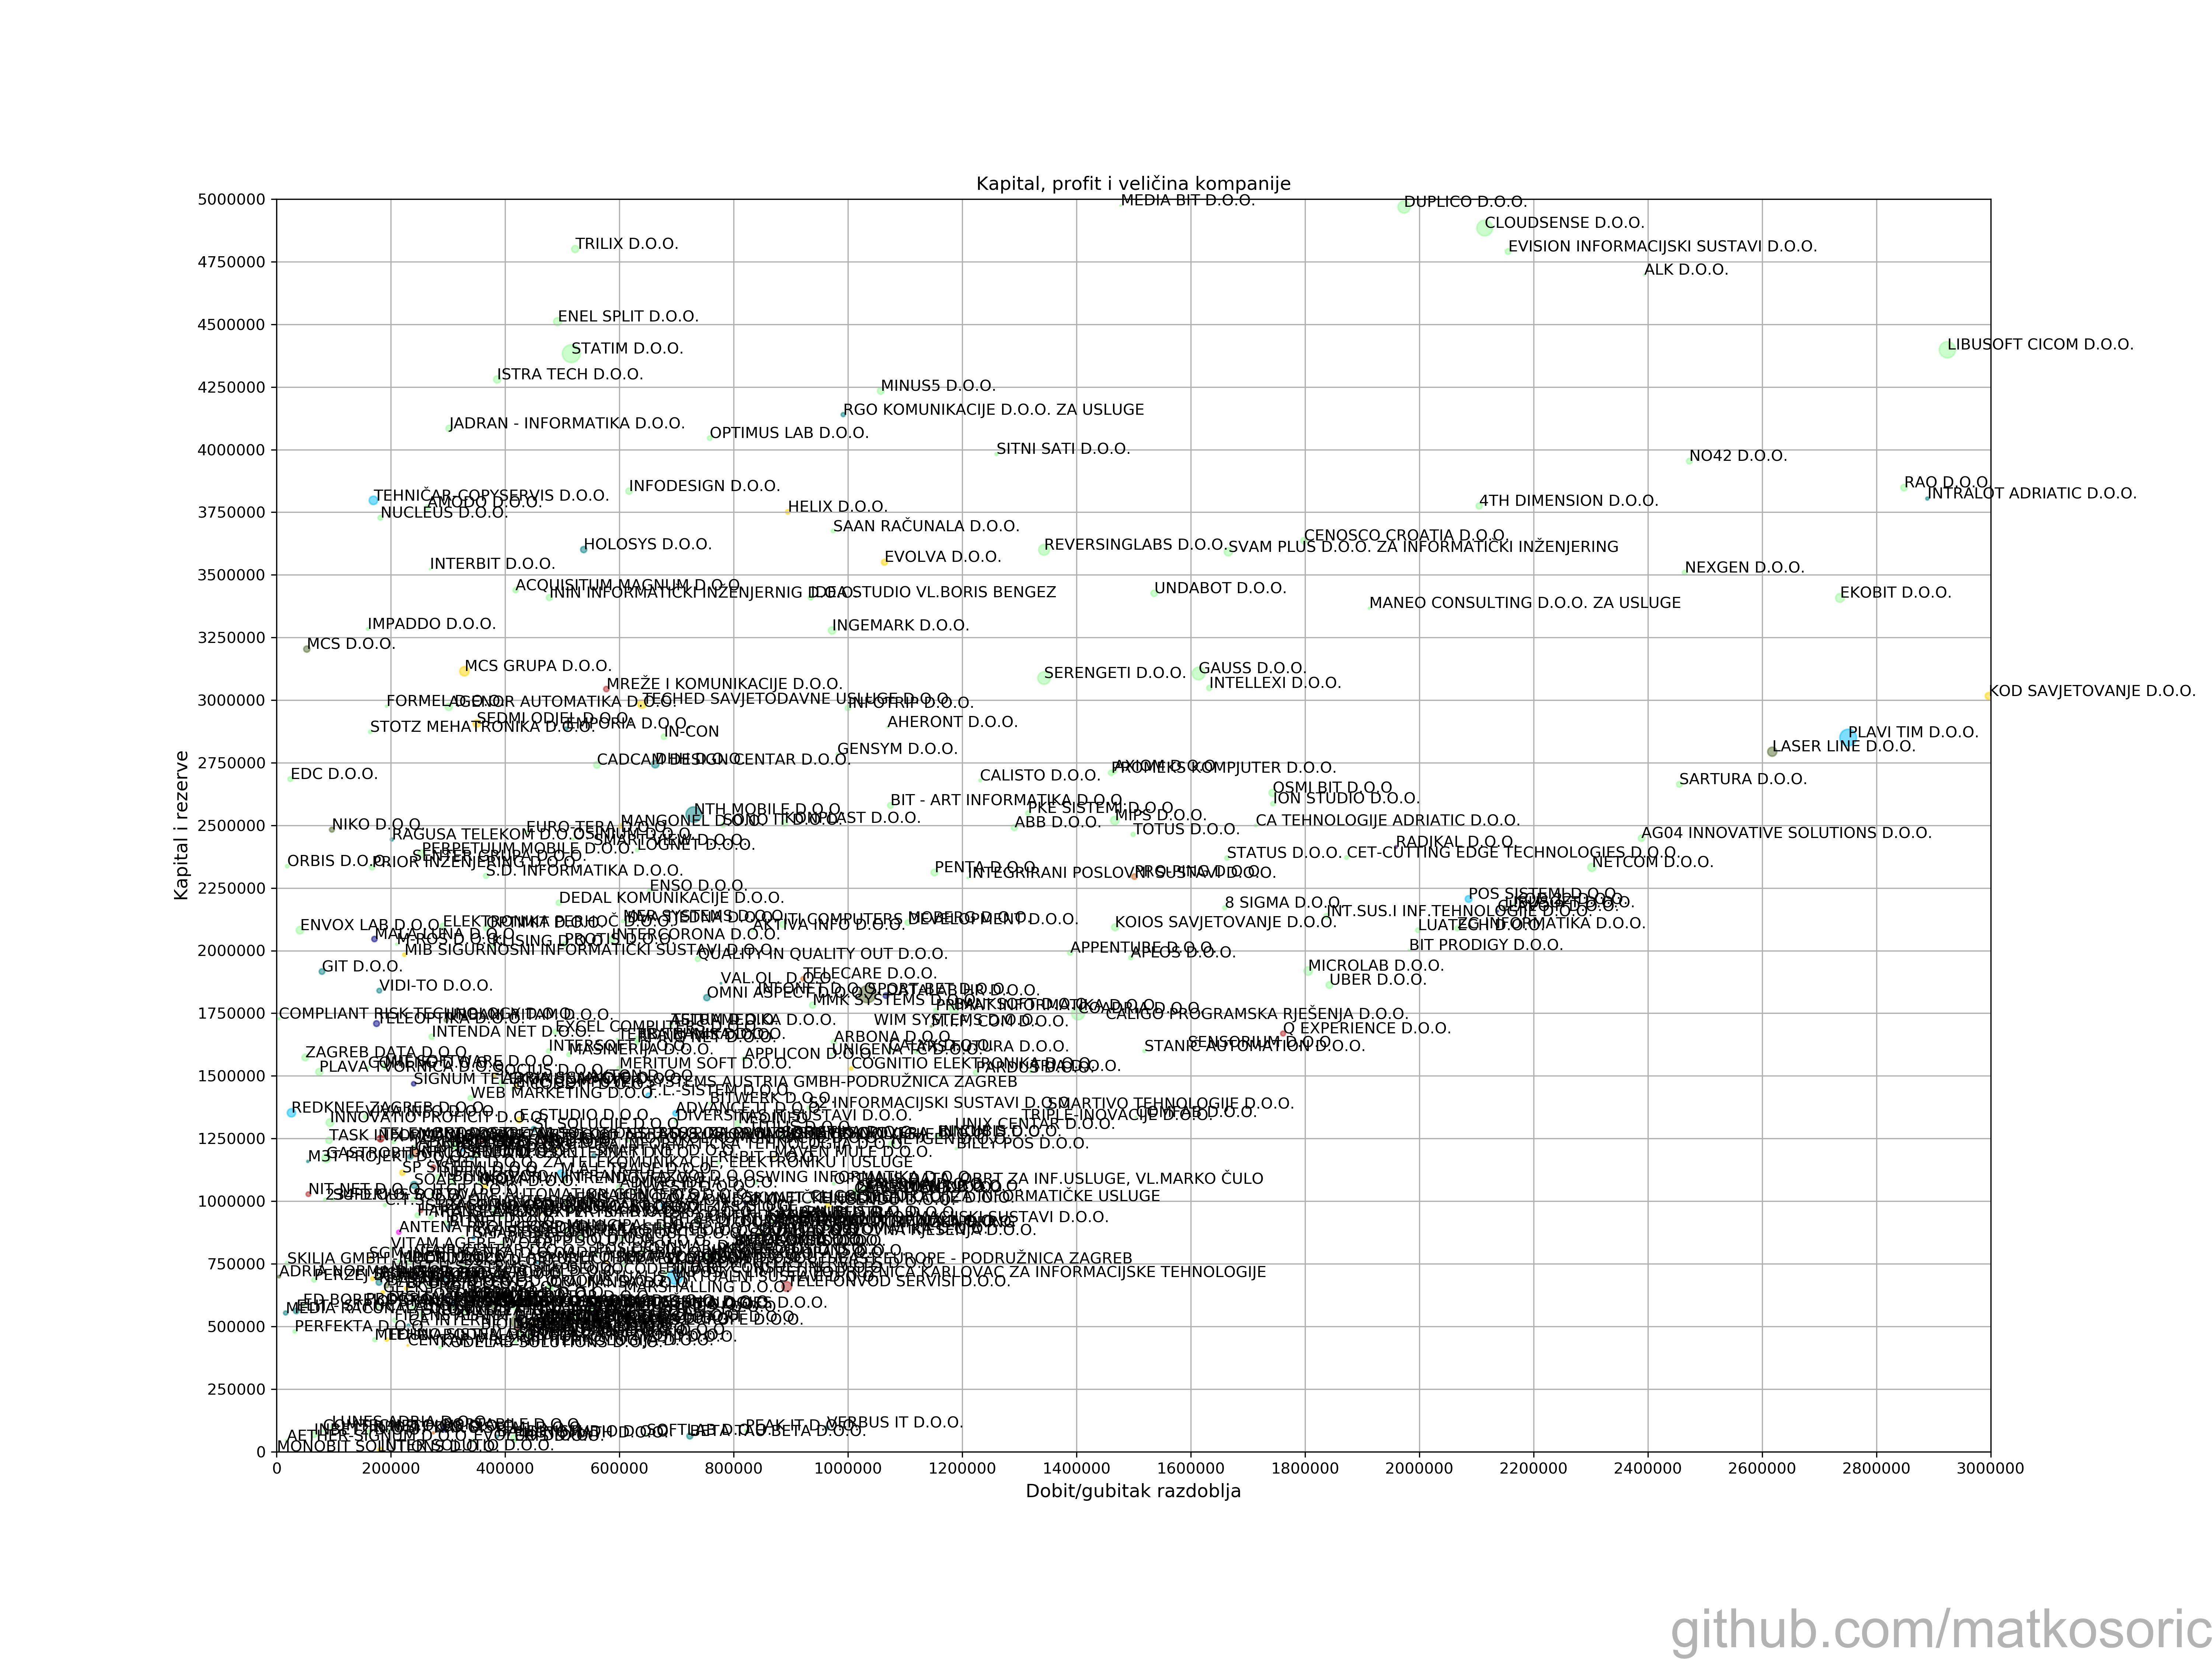
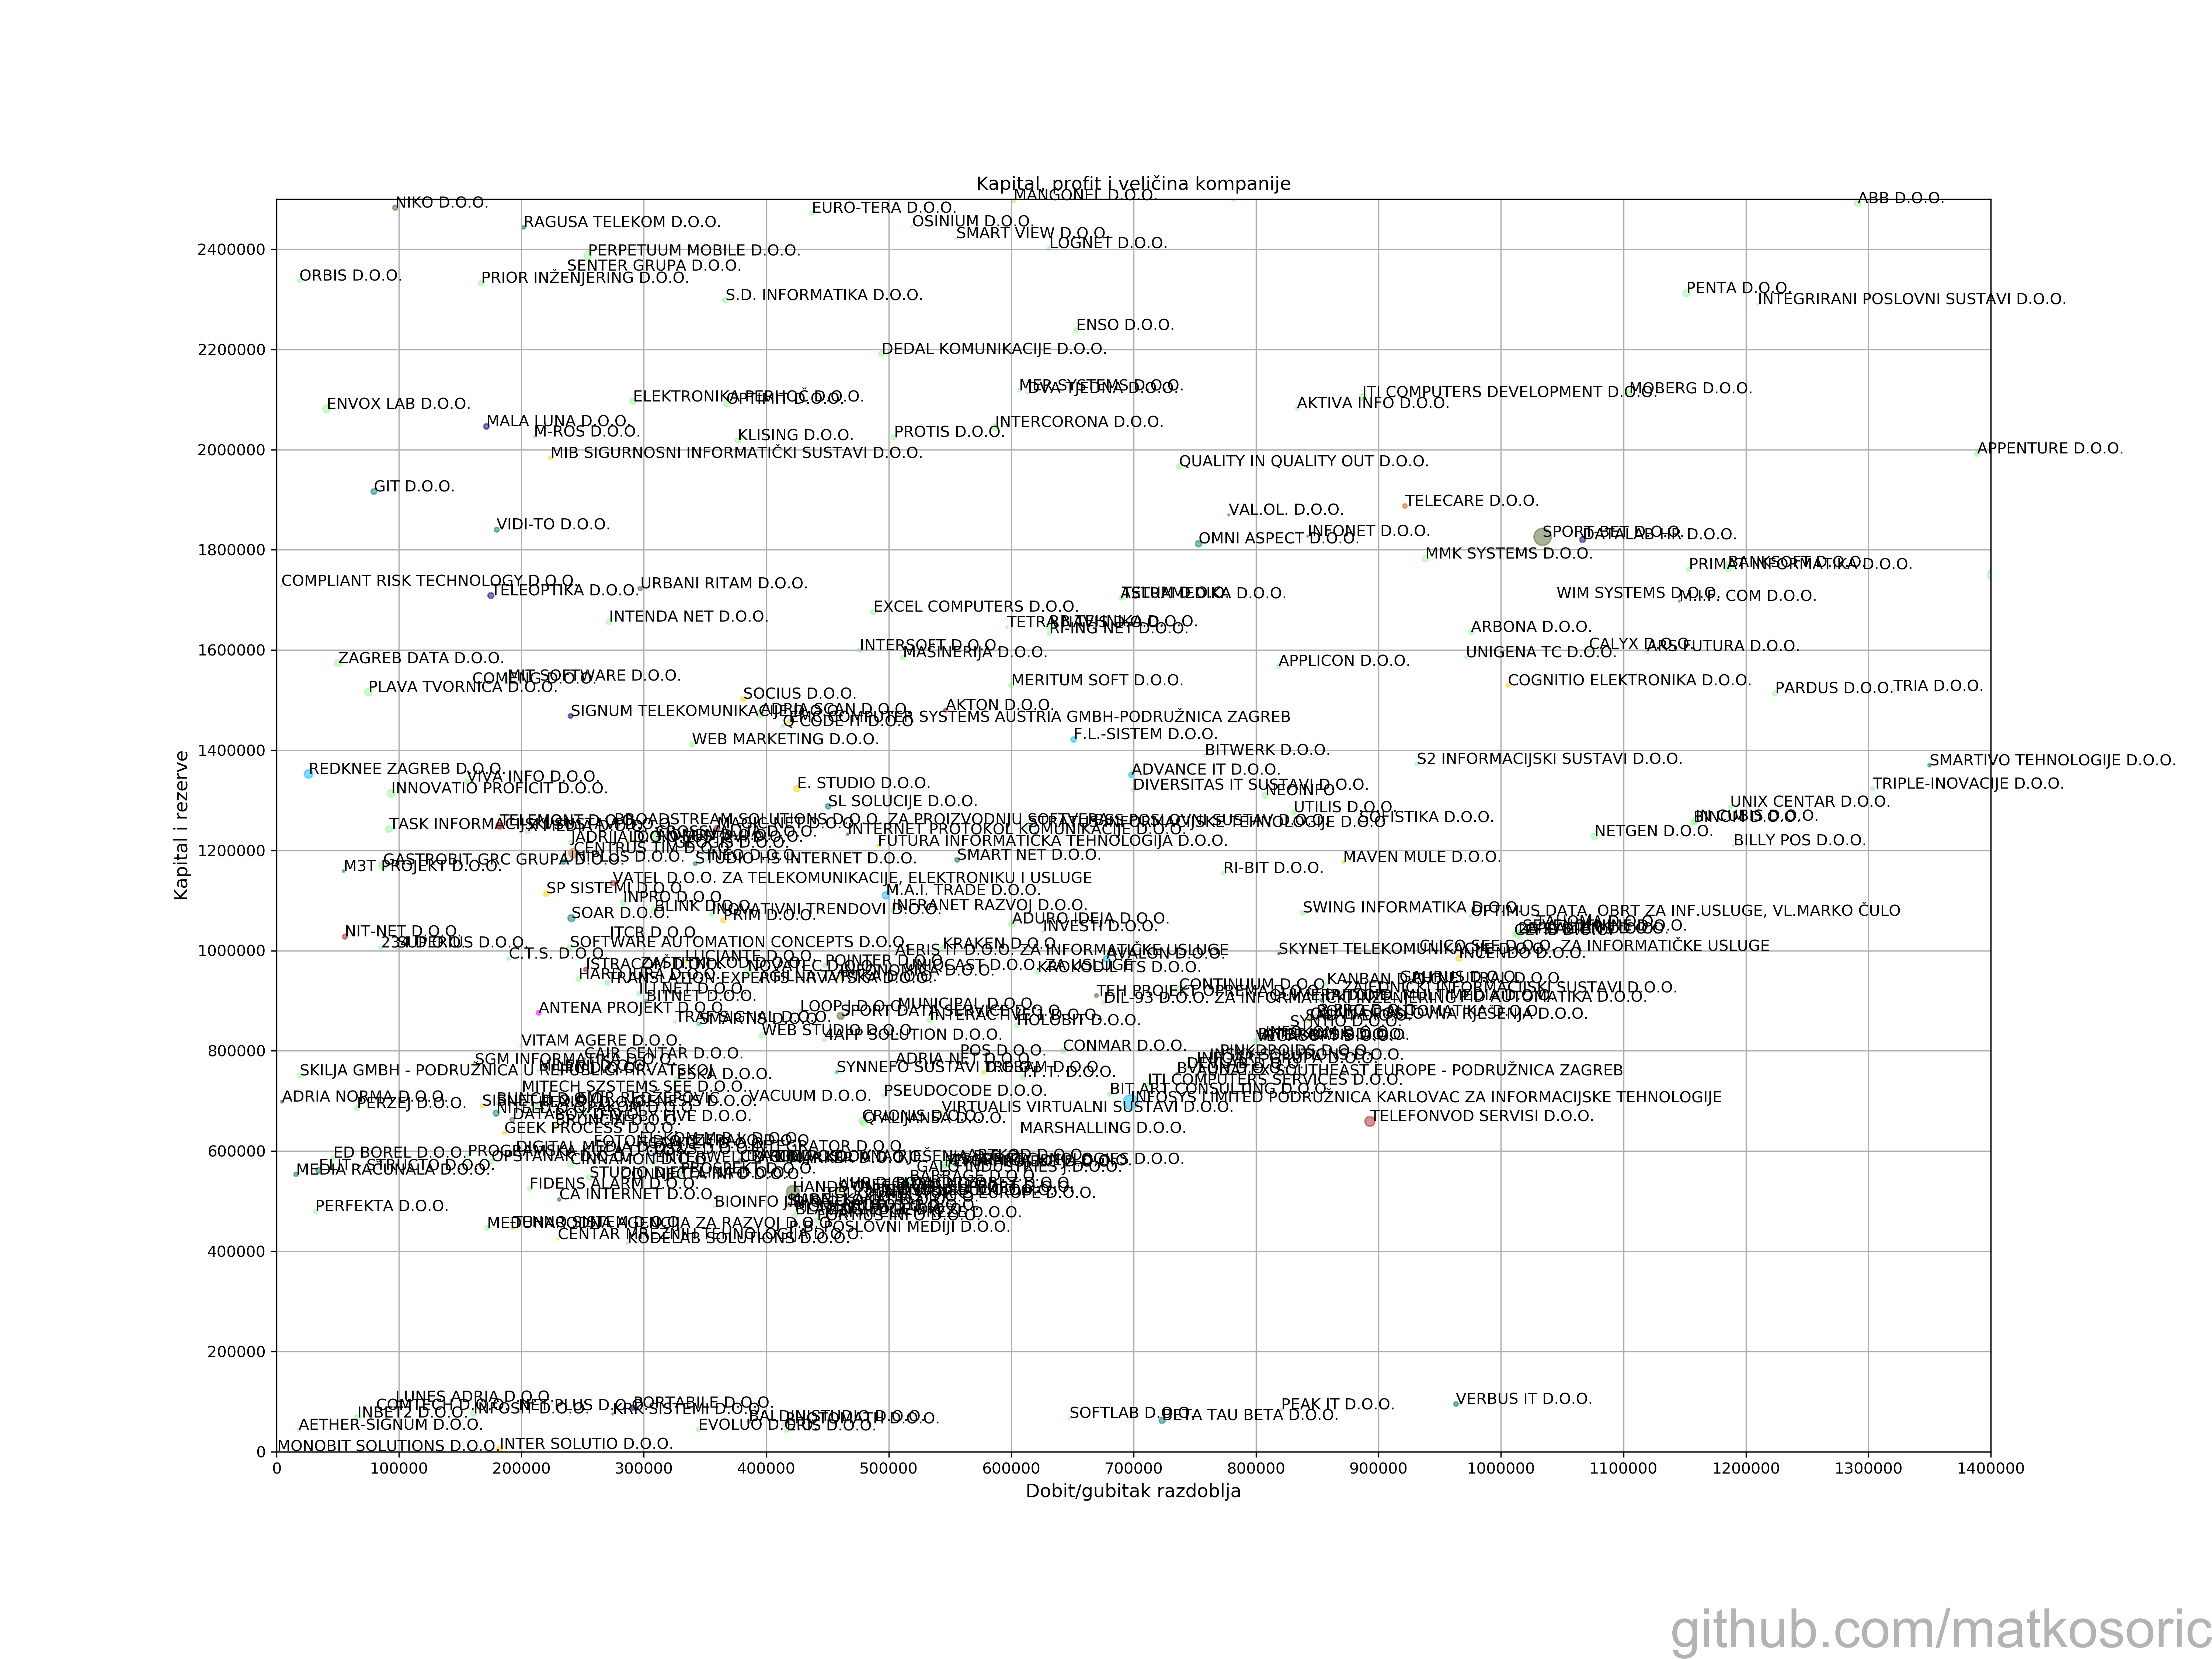
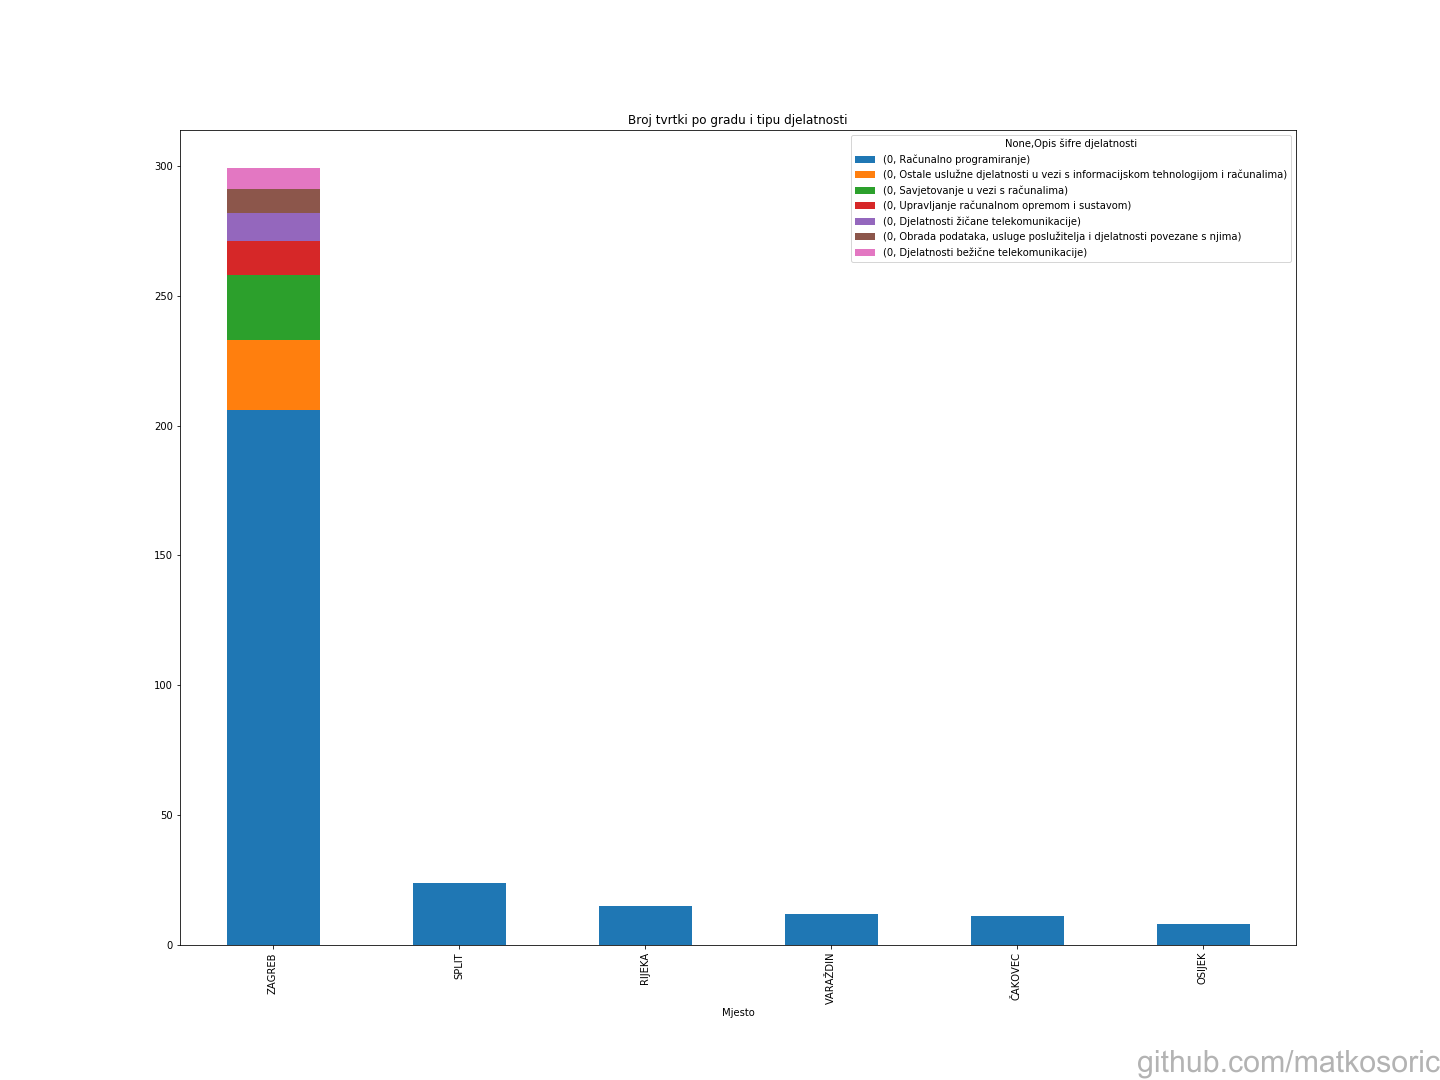
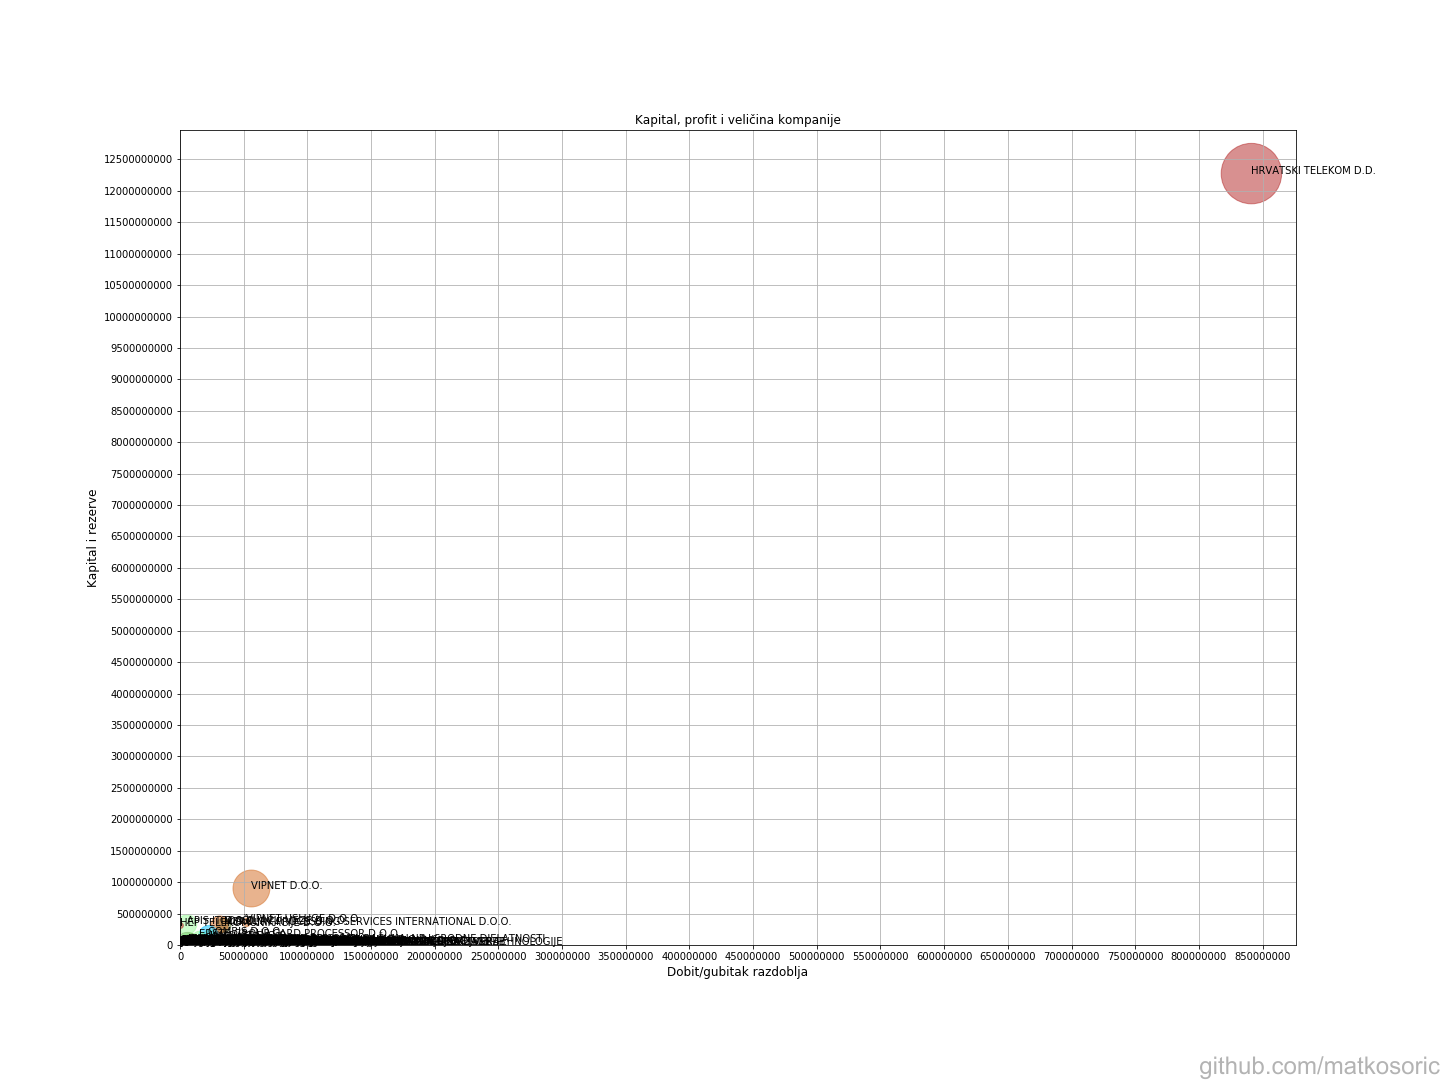
First five images are presenting relation of company’s capital to the annual profit, while simultaneously showing relations of company size and type of main economic activity. X axis is mapped to annual profit, Y axis is mapped to capital and reserves. Circle size is correlated to the number of employees, while circle color represents type of work in the IT sector, such as computer programming, counseling(6202), wireless communication (6120), data analysis (6311), equipment management (6203), or uncategorized activity (6209). First image clearly illustrates extremely dominating position of T-Com company. Following images are presenting the same data with different levels of zoom. Last figure is a bar chart, revealing Zagreb as a software center, and computer programming as a sole activity of companies in different cities.
Original DataSet
I used the data from a report about top 1000 companies in Croatian IT according to different criteria. Then I merged them using Spark 2.4. Some companies did not make it to final list intentionally, so that the combined dataset has all values in all columns. I was using the same data in Apache Superset project, but that images are misleading due to the numerous bugs in Superset as still incubating project.
Created With
