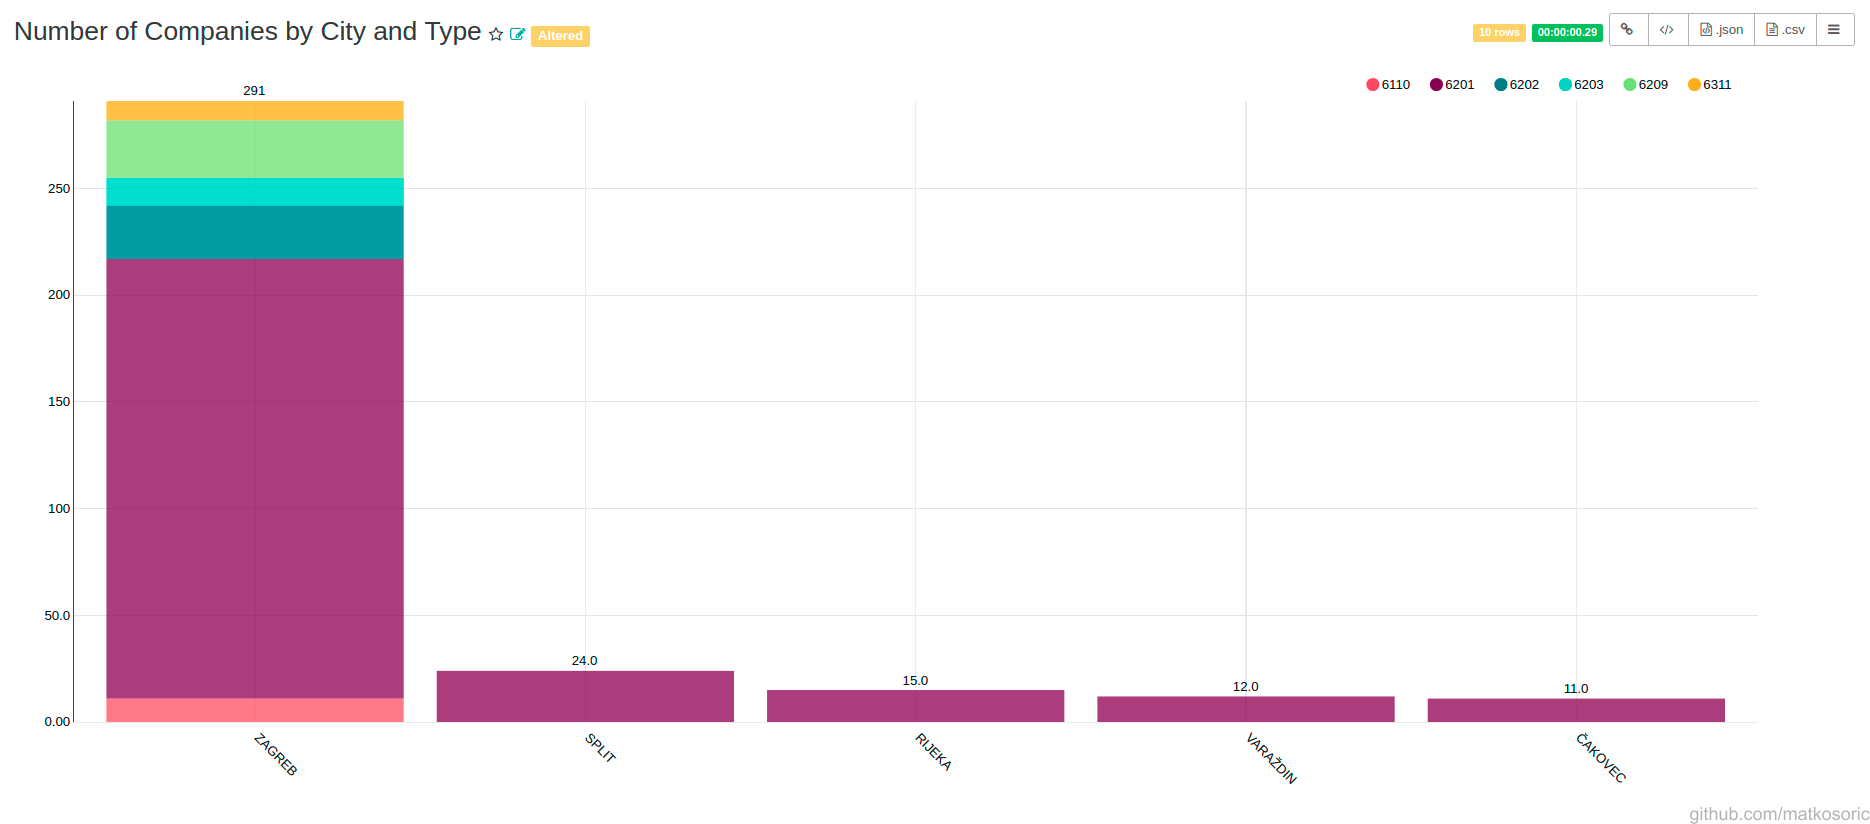
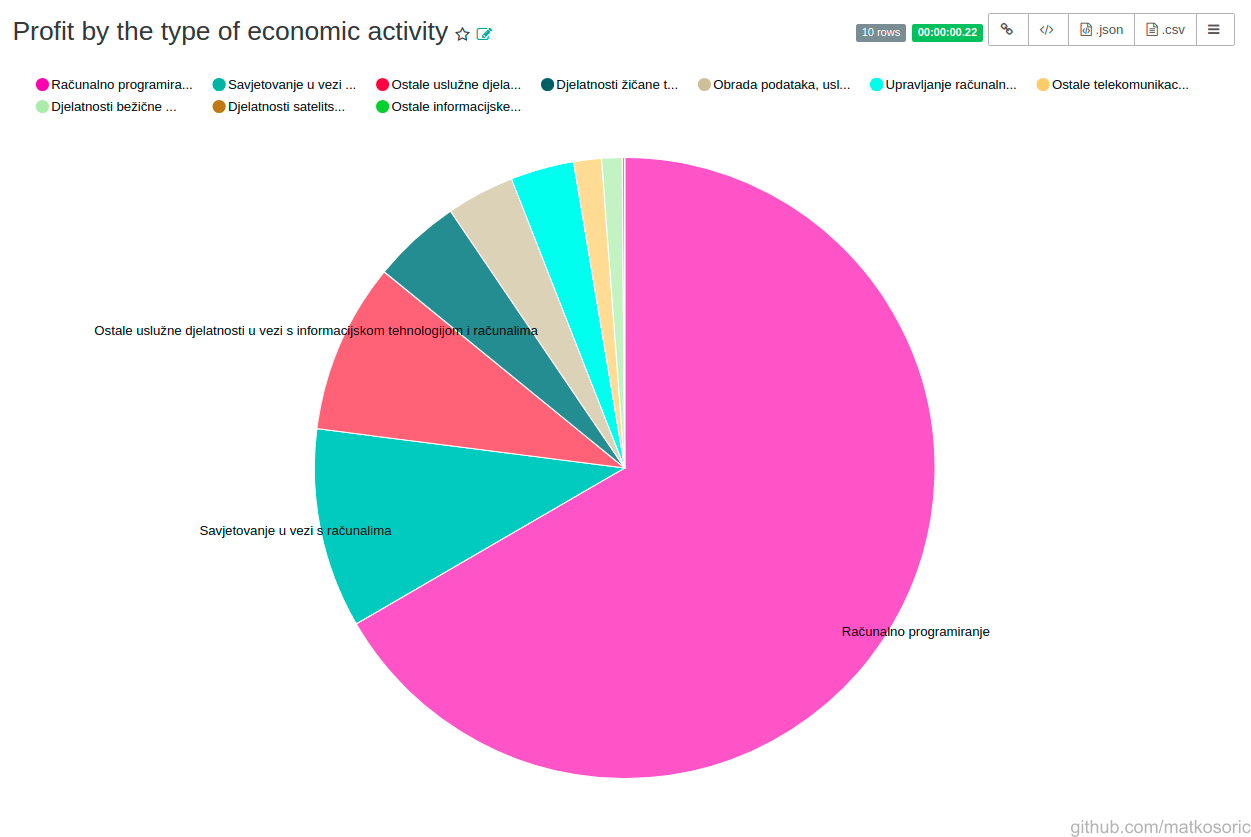
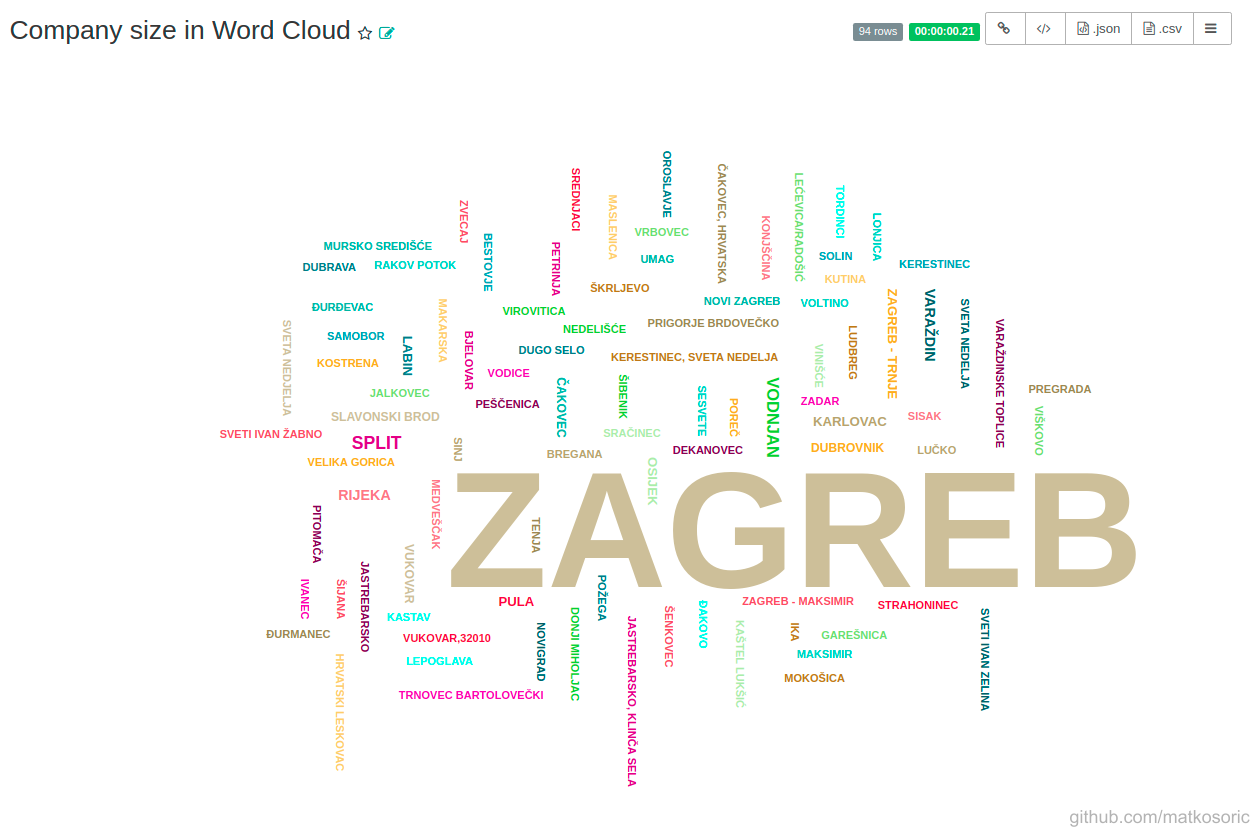
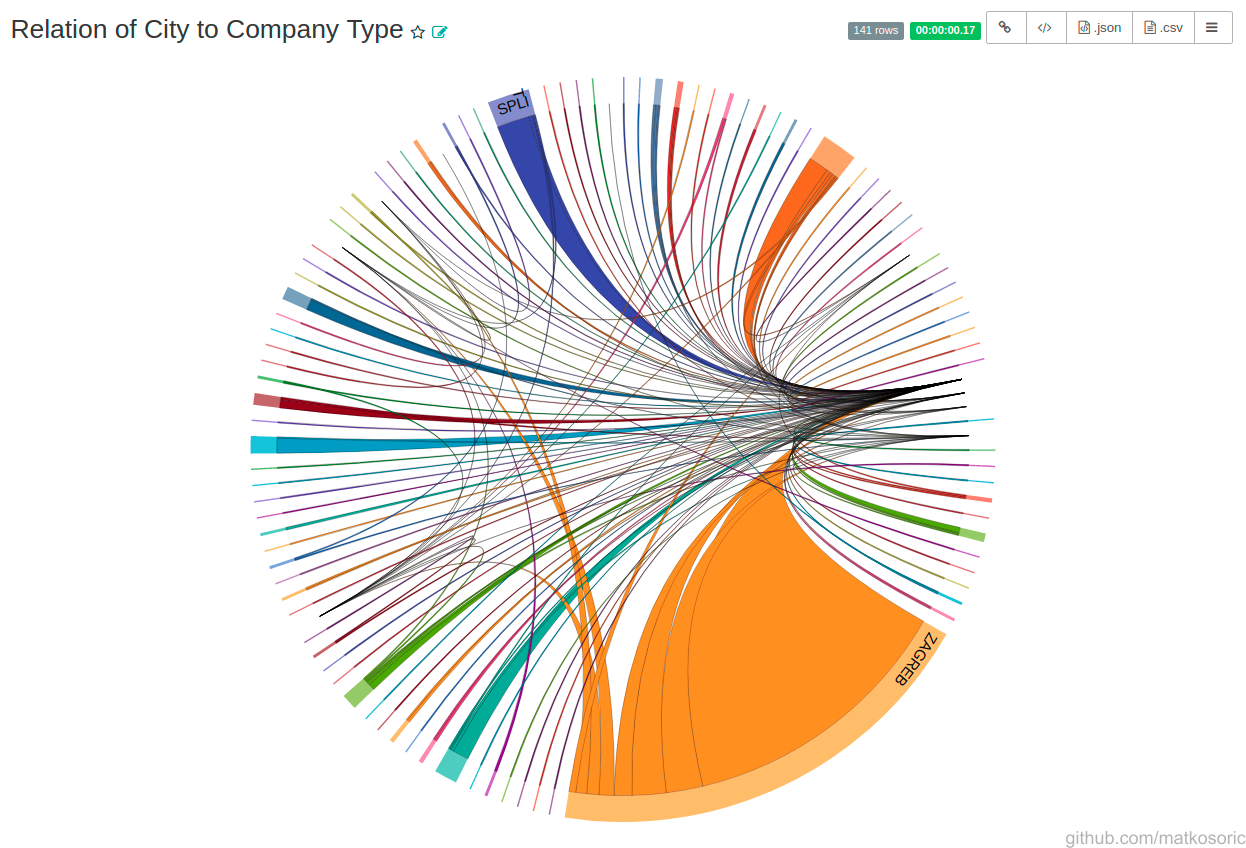
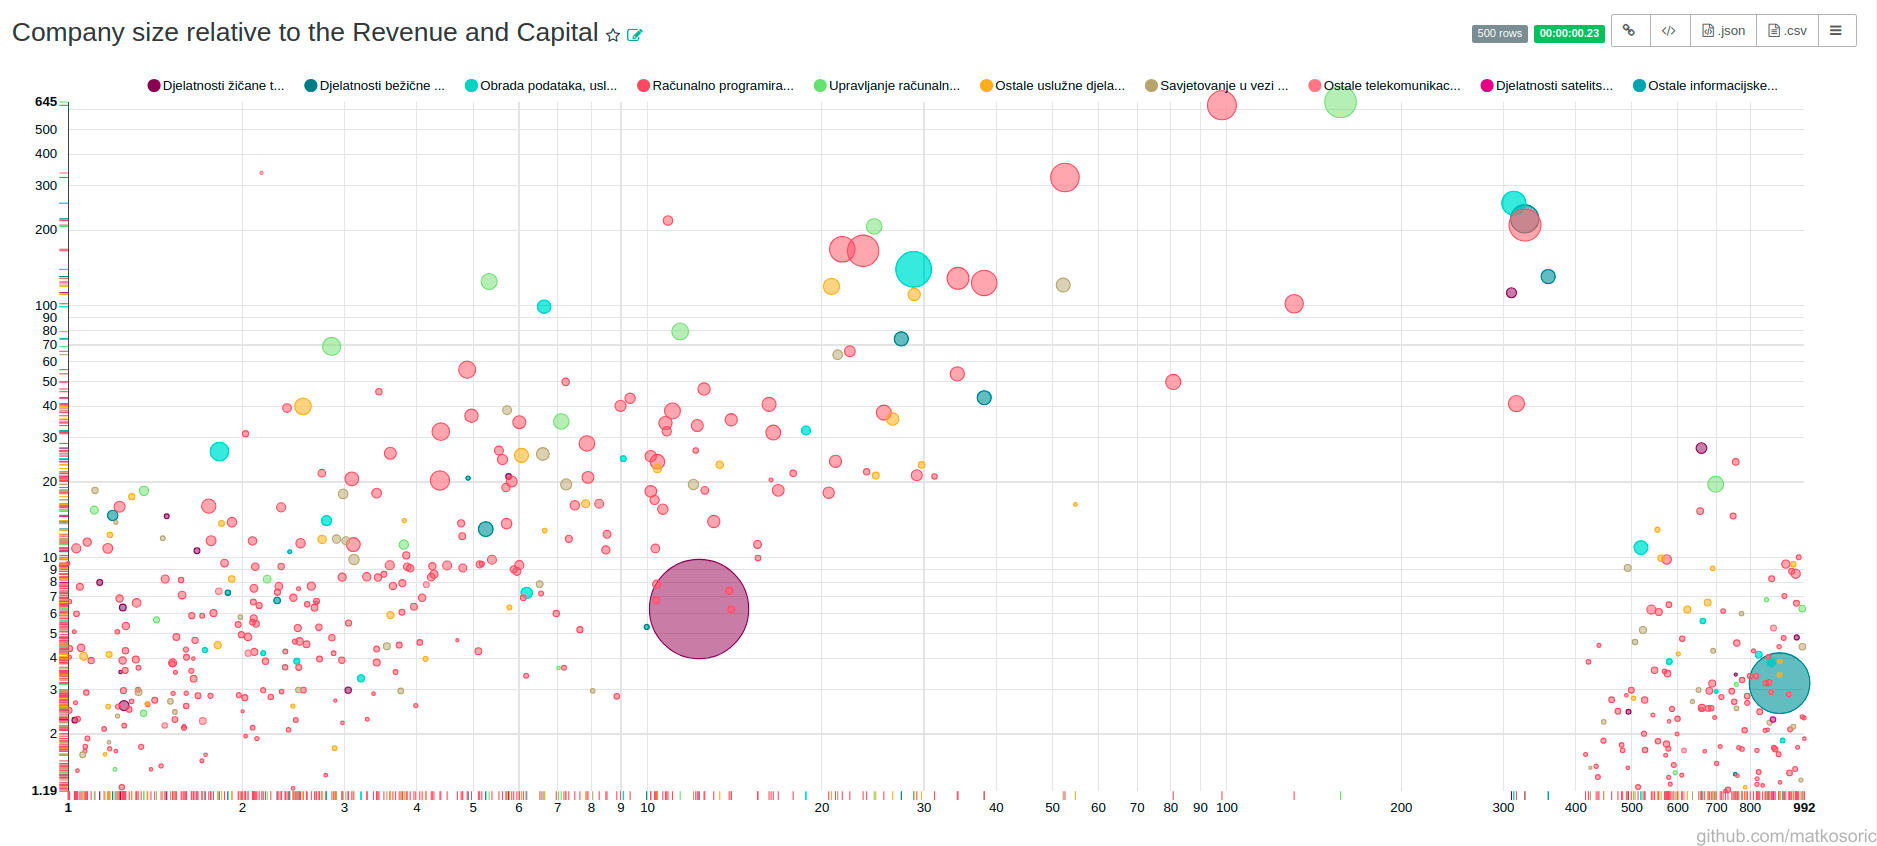
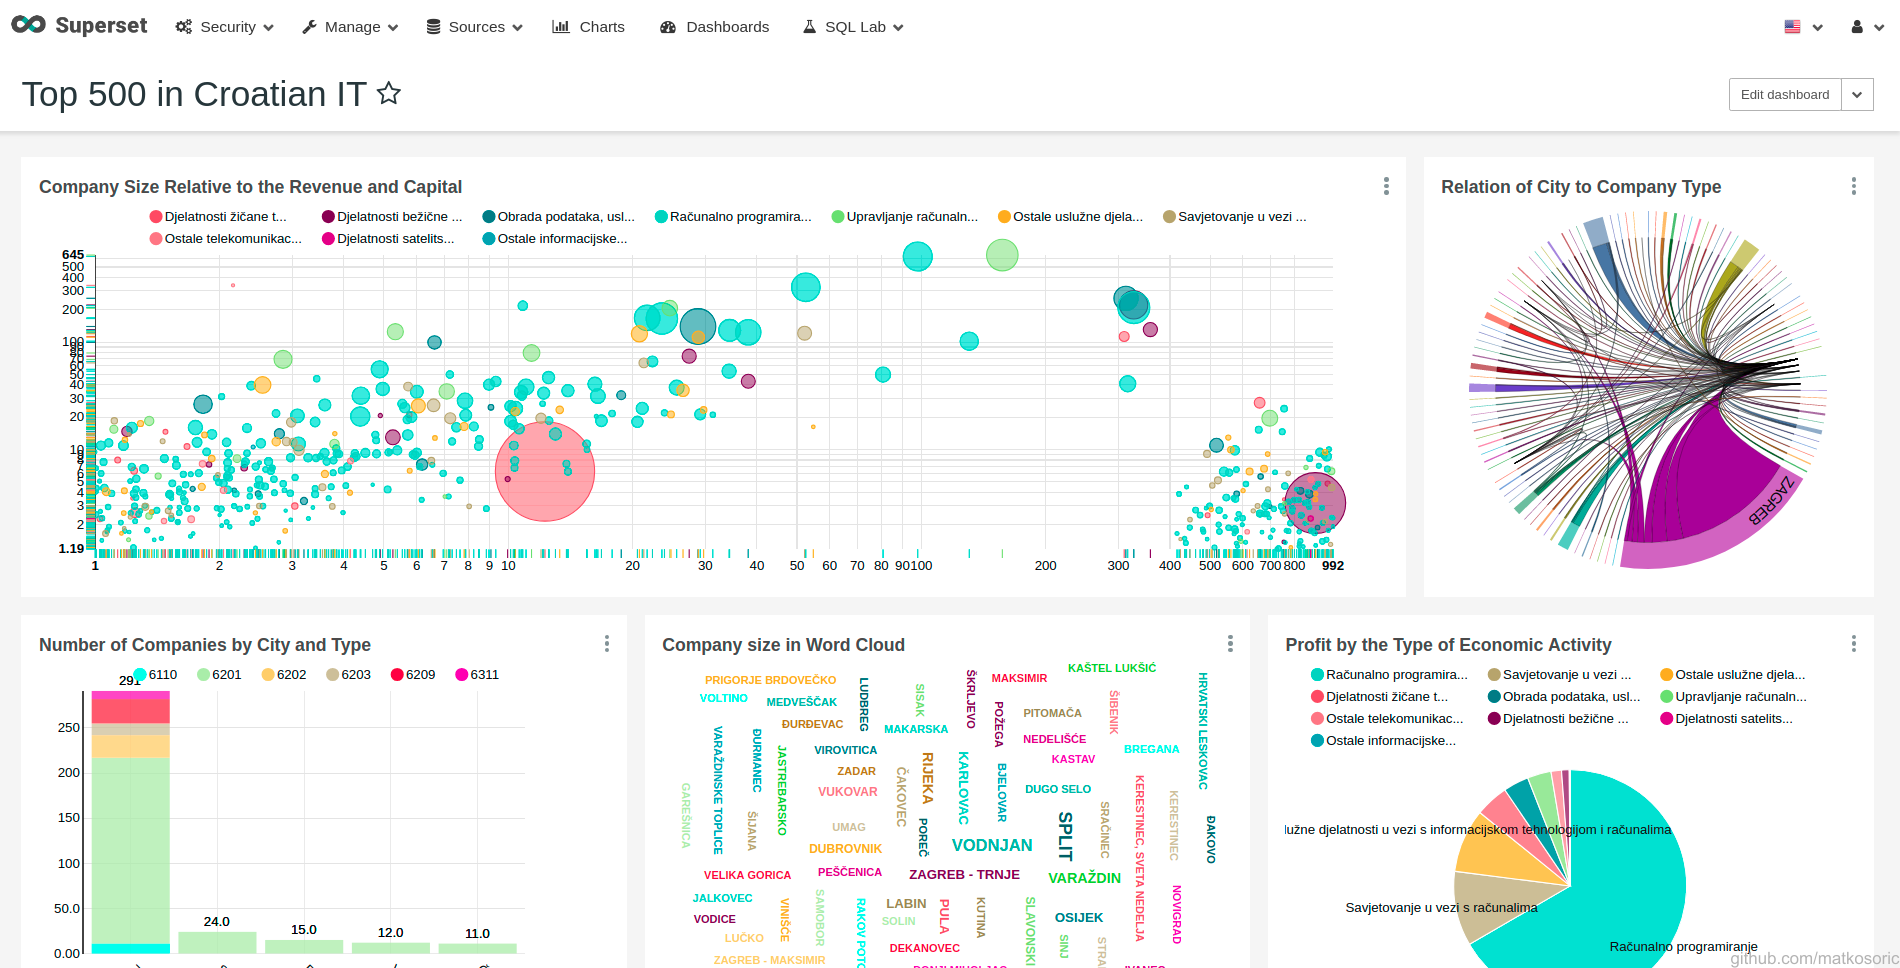
First image is a dashboard composed of all other figures. Second figure is a bar chart of companies grouped by city and activity. There is a clear domination of capital city (Zagreb) where are most of the companies registered. However, there is also a clear domination of 6201 code, which denotes ‘Computer programming’. Interestingly, other cities have companies only in this domain, and nothing in counseling(6202), wireless communication (6120), data analysis (6311), equipment management (6203), or even uncategorized activity (6209). Third image represents profit allocation with a pie chart. Roughly two thirds annual profits are from computer programming. Fourth image is a word cloud that counts employees in each city and presents them in adequate ratio. Clearly, Zagreb as a capital city with the most companies has the largest word size. Fifth is a chord diagram that connects company location with activity. Again, presence of Zagreb and programming is easily notceable. Sixth image is a bubble chart. Each data point represents one company. X axis is mapped to a value of ‘Capital and reserves’. Y axis is mapped to the annual revenue. Scales are logarithmically adjusted. Bubble size is linked to the number of employees in the company, while bubble color is linked to the activity type. Presence of red coloer indicated ‘Computer programming’ category. Big purple circle in the middle is Croatian Telecom (Hrvatski Telekom). Big bluish circle in the bottom right corner is VipNet. Since SuperSet reads these numbers as strings, ratios are not correct, and the same figure should be done properly with another tool.
Original DataSet
I used the data from a report about top 1000 companies in Croatian IT according to different criteria. Then I merged them using Spark 2.4. Some companies did not make it to final list intentionally, so that the combined dataset has all values in all columns.
Created With
