2025
Transition to Post-Quantum Cryptography Standards
This report describes NIST’s expected approach to transitioning from quantum-vulnerable cryptographic algorithms to post-quantum digital signature algorithms and key-establishment schemes. It identifies existing quantum-vulnerable cryptographic standards and the quantum-resistant standards to which information technology products and services will need to transition. It is intended to foster engagement with industry, standards organizations, and relevant agencies to facilitate and accelerate the adoption of post-quantum cryptography.
Private and Verifiable Computation
PhD thesis by Dimitris Mouris on private computation:
DevOps topologies
DevOps topologies:
You Are Not Google
Oz Nova about scale misconceptions and wrong architectural decisions.
Hidden Technical Debt in Machine Learning Systems
Google’s article about various types of debt and anti-patterns in ML systems.
Programs, Life Cycles, and Laws of Software Evolution
Meir Lehman on maintainability and software development lifecycle.
Module-Lattice-Based Key-Encapsulation Mechanism Standard
A key-encapsulation mechanism (KEM) is a set of algorithms that, under certain conditions, can be used by two parties to establish a shared secret key over a public channel. A shared secret key that is securely established using a KEM can then be used with symmetric-key cryptographic algorithms to perform basic tasks in secure communications, such as encryption and authentication. This standard specifies a key-encapsulation mechanism called ML-KEM. The security of ML-KEM is related to the computational difficulty of the Module Learning with Errors problem. At present, ML-KEM is believed to be secure, even against adversaries who possess a quantum computer. This standard specifies three parameter sets for ML-KEM. In order of increasing security strength and decreasing performance, these are ML-KEM-512, ML-KEM-768, and ML-KEM-1024.
DevOps capabilities
Capabilites identified by DORA, some of which are:
Google Cloud Architecture Framework
Google Cloud Architecture Framework:
2024
The C-Suite Skills That Matter Most
When we refer to “social skills,” we mean certain specific capabilities, including a high level of self-awareness, the ability to listen and communicate well, a facility for working with different types of people and groups, and what psychologists call “theory of mind”—the capacity to infer how others are thinking and feeling. The magnitude of the shift in recent years toward these capabilities is most significant for CEOs but also pronounced for the four other C-suite roles we studied.
To How To Stay Ahead of Data Debt and Downtime
Etai Mizrahi from Secoda about data debt.
Genomics ETL
This is a demo data engineering project built on Azure cloud. ETL pipeline implemented in Azure Data Factory is ingesting and transforming Illumina Platinum Genomes dataset. Terraform is used for provisioning infrastructure. Deployment pipelines are implemented in GitHub actions in accordance with official Microsoft guidelines, with working CICD process between DEV and PROD environments. DEV ADF is connected to git repository, and ARM templates are propagated to PROD environment through GitHub action.
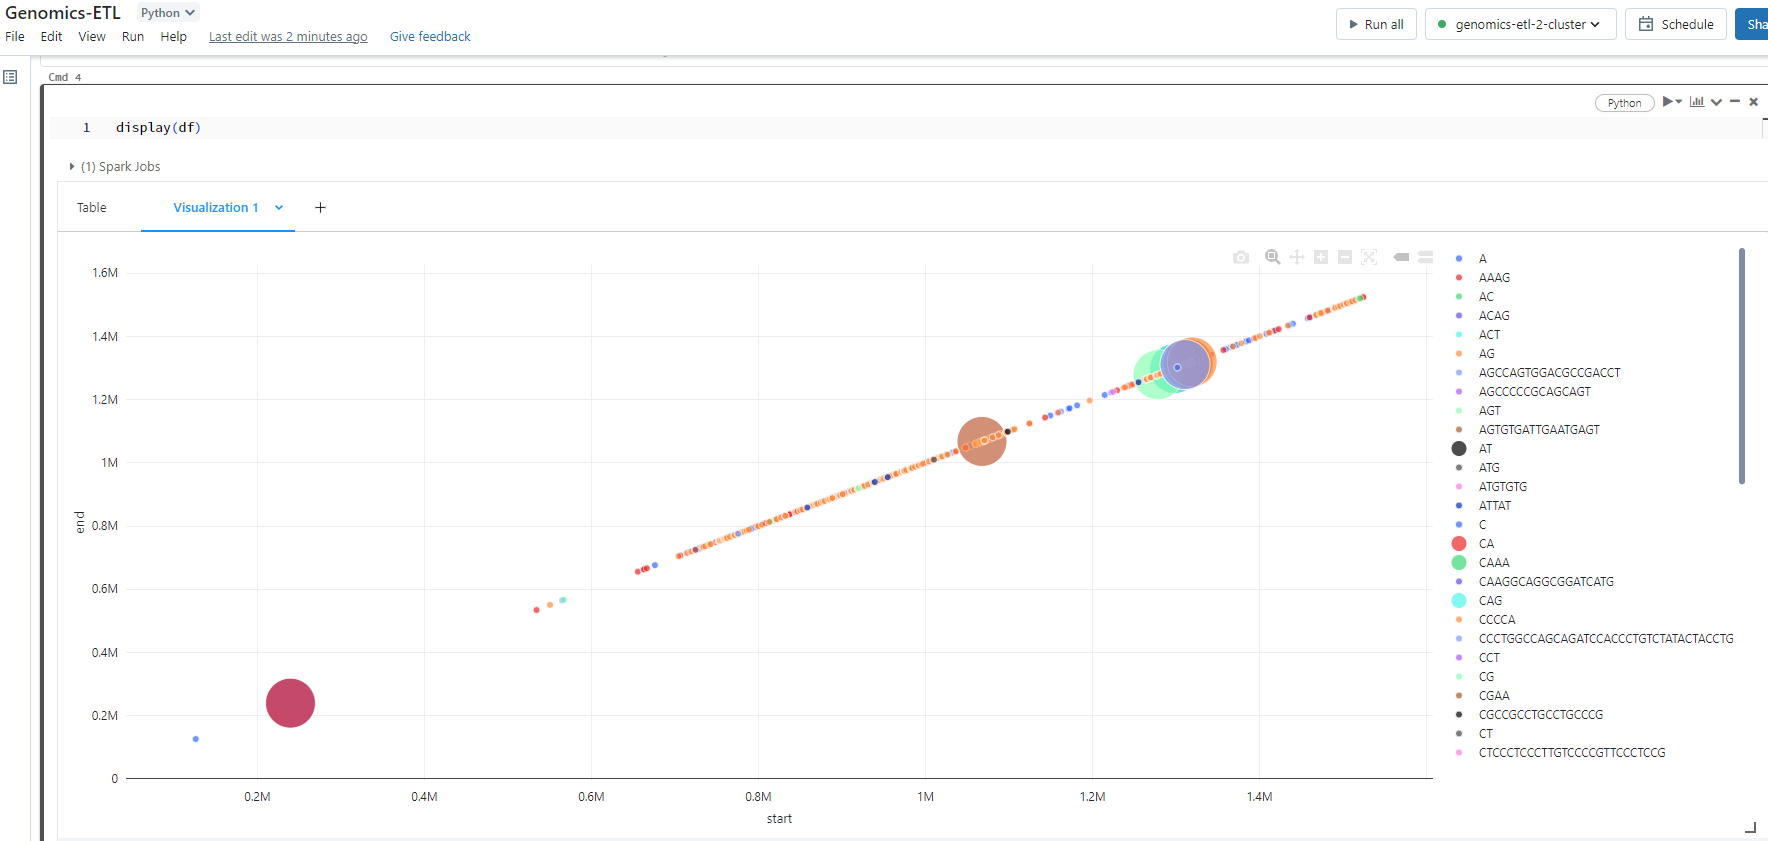
Databricks visualization:
Out of the Tar Pit
Ben Moseley and Peter Marks on complexity.
Down with pipeline debt
Key takeaways:
What Is DataOps?
DataOps is a collection of technical practices, workflows, cultural norms, and architectural patterns that enable:
The DataOps Manifesto
Principles of DataOps:
Coding memes 2
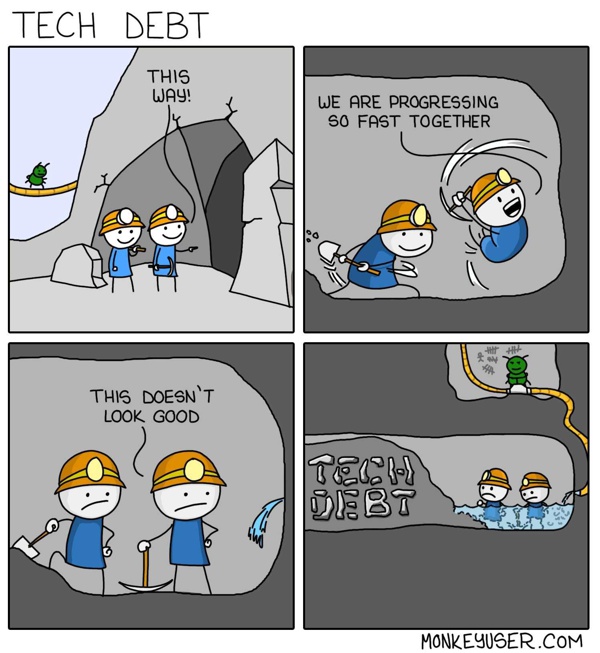
John Cutler - 12 Signs You’re Working in a Feature Factory
Salient list of red flags and anti-patters of poor project setup by John Cutler:
2023
Fallacies of distributed computing
- The network is reliable;
- Latency is zero;
- Bandwidth is infinite;
- The network is secure;
- Topology doesn’t change;
- There is one administrator;
- Transport cost is zero;
- The network is homogeneous;
Choose Boring Technology
Dan McKinley on architectural decisions.
The Ultimate Data Observability Checklist
Pillars of data observability
Preparing the Cyber Battlefield
Many cyber operations are governed by a simple fact: In order to develop a cyber capability with a potent or customized effect on a target network, substantial reconnaissance and preparation are required from within that targeted network. (Buchanan & Cunningham 2020, 58)
Principles of chaos engineering
Chaos Engineering is the discipline of experimenting on a system in order to build confidence in the system’s capability to withstand turbulent conditions in production.
Alan J. Perlis - Epigrams on Programming
120 aphorisms on programming, written in 1982 and with many of them still surprisingly valid, some of which are:
State of DevOps 2022
Google’s State of DevOps 2022 report
The 12 Principles behind the Agile Manifesto
12 principles of Agile software, with my favorite:
Résumé-Driven Development
Paper about resume driven development and its impacts on projects.
Resume-Driven Development (RDD) is an interaction between human resource and software professionals in the software development recruiting process. It is characterized by overemphasizing numerous trending or hyped technologies in both job advertisements and CVs, although experience with these technologies is actually perceived as less valuable on both sides. RDD has the potential to develop a self-sustaining dynamic.
Potential consequences of RDD are mainly decreased software quality and increased employee turnover due to false expectations on both sides
2022
Deploy Databricks on Azure with Terraform
This is a minimal example for deploying Databricks service on Azure. The smallest number of nodes in the cluster will be 1, and maximum 5. Node type will be the smallest one, and Spark version the latest one with long term support. You will be able to log in automatically with your SSO user. Auto-termination is set to 20 minutes.

CIS benchmarks
Link to CIS benchmarks
Software engineering at Google - book link
Link to O’Reilly book Software engineering at Google
Zero Trust Architecture
Zero trust (ZT) is the term for an evolving set of cybersecurity paradigms that move defenses from static, network-based perimeters to focus on users, assets, and resources. A zero trust architecture (ZTA) uses zero trust principles to plan industrial and enterprise infrastructure and workflows. Zero trust assumes there is no implicit trust granted to assets or user accounts based solely on their physical or network location (i.e., local area networks versus the internet) or based on asset ownership (enterprise or personally owned). Authentication and authorization (both subject and device) are discrete functions performed before a session to an enterprise resource is established. Zero trust is a response to enterprise network trends that include remote users, bring your own device (BYOD), and cloud-based assets that are not located within an enterprise-owned network boundary. Zero trust focuses on protecting resources (assets, services, workflows, network accounts, etc.), not network segments, as the network location is no longer seen as the prime component to the security posture of the resource. This document contains an abstract definition of zero trust architecture (ZTA) and gives general deployment models and use cases where zero trust could improve an enterprise’s overall information technology security posture.
Amazon review dataset translations for sentiment analysis
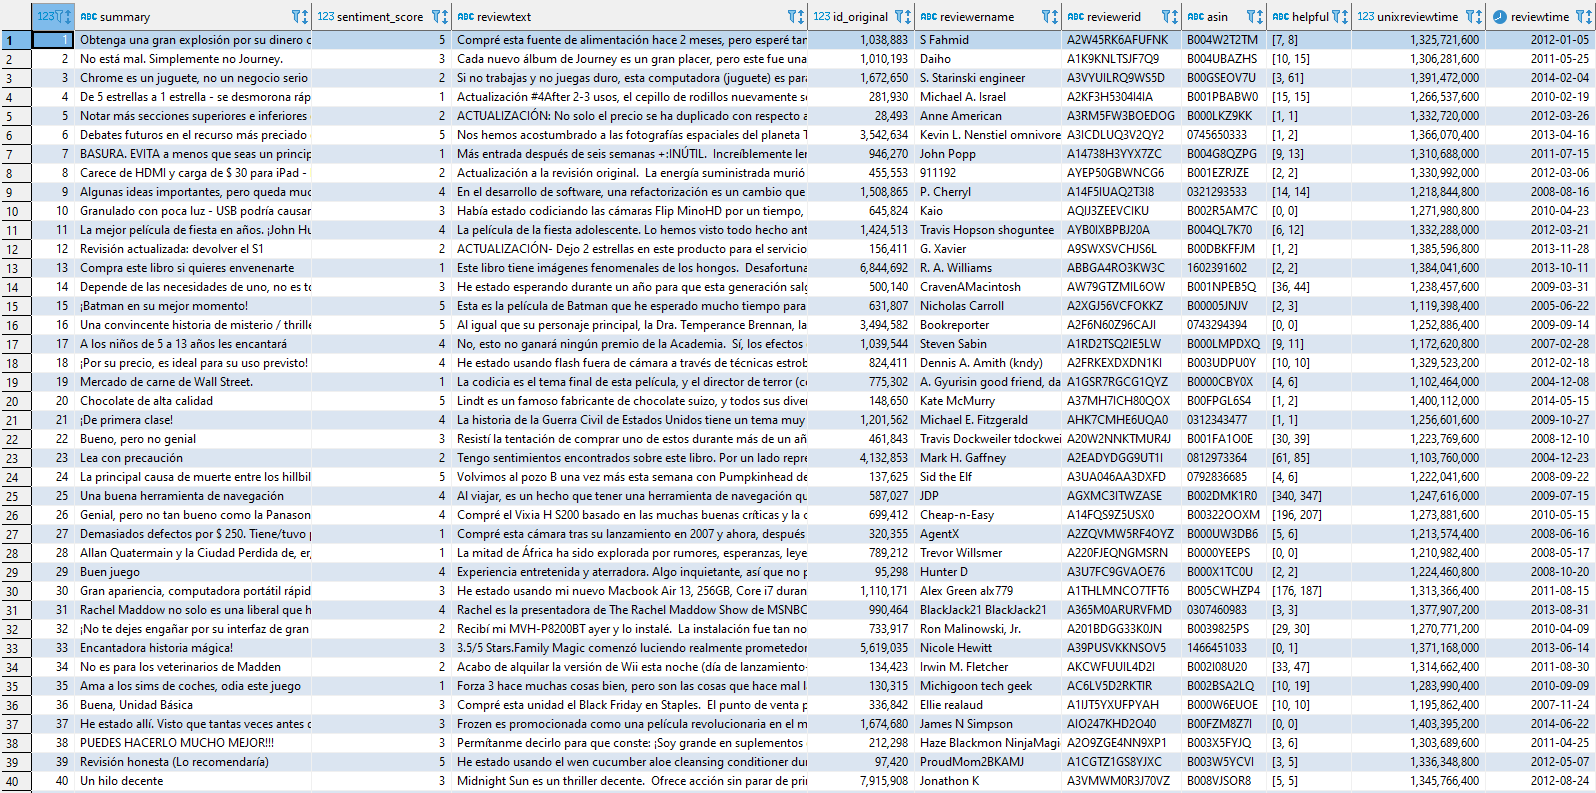
This repository contains translations of a 150 000 randomly selected entries from Amazon dataset originally created by Julian McAuley and Jianmo Ni, containing over 20GB of data. The goal is to create smaller datasets for sentiment analysis on languages other than English, for which there are many publicly available datasets already. Translation is performed with Microsoft Azure’s Translator cloud service.
12 Factor app
12 Factor app page
Shodan Monitor
Catalog of publicly exposed services
Java OCP exam code snippets
These are my preparation exercises for the OCP exam. Each example is self-contained, executable code snippet. Usually, my examples are based on meaningful illustration and clear functionality, as in this case of BiPredicate lambda function:
        // Map
        Map<Integer, String> henryFondaMovies = new HashMap<>();
        henryFondaMovies.put(1962, "The Longest Day");
        henryFondaMovies.put(1940, "The Grapes of Wrath");
        henryFondaMovies.put(1964, "Fail-Safe");
        henryFondaMovies.put(1957, "12 Angry Men");
        henryFondaMovies.put(1937, "You Only Live Once");
        henryFondaMovies.put(1938, "The Mad Miss Manton");

        BiPredicate<Integer, String> yearFilter = ((year, title) -> year > 1950);
        BiPredicate<Integer, String> titleFilterNumeric = ((year, title) -> title.matches(".*\\d+.*"));
        BiPredicate<Integer, String> titleFilterThe = ((year, title) -> title.contains("The"));

        // this will print only movies that are released after the 1950
        for (Map.Entry<Integer, String> entry : henryFondaMovies.entrySet())
            if (yearFilter.test(entry.getKey(), entry.getValue()))
                System.out.println("after 1950: " + entry.getValue());

        // this will print only movies that contain number in the title
        for (Map.Entry<Integer, String> entry : henryFondaMovies.entrySet())
            if (titleFilterNumeric.test(entry.getKey(), entry.getValue()))
                System.out.println("number in title: " + entry.getValue());

        // this will print only movies that contain "The" in the title
        for (Map.Entry<Integer, String> entry : henryFondaMovies.entrySet())
            if (titleFilterThe.test(entry.getKey(), entry.getValue()))
                System.out.println("the in title: " + entry.getValue());
Useful Youtube channels
Useful YouTube channels for learning and keeping up with the community.
State of DevOps 2021
Google’s State of DevOps 2021 report
Kubernetes security
Kubernetes security best practices guidelines
Computer Science courses
Coding memes
A couple of coding memes.

2021
Disasters I’ve seen in a microservices world
Partial list of difficulties with servicitis, by João Alves:
Data Fabric defined
James Serra on Data fabric:
Questions and answers portal on Spanish - nuestras-preguntas.net
www.nuestras-preguntas.net was my demo project for questions and answers platform on Spanish language with full text search capability. Application was completely configurable, so switch to another language could be easily accomplished by providing translation for existing fields. It was running in production for nine months, with two million question and answer pairs. CICD pipeline was built in Jenkins, and application was running in Docker container on Digital Ocean hosting service. Whole system had four containers: SpringBoot application, ElasticSearch database, LetsEncrypt certbot, and Nginx proxy. They were orchestrated with Docker compose. VM instance had 8GB of RAM, and ElasticSearch was by far the largest consumer of resources. My architectural decisions were mainly guided by cost reduction, and comparable cloud solutions would be orders of magnitude more expensive.
Applications unique feature was anonymous usage, meaning registration with email was not necessary to submit a question or answer, or vote. I developed a custom encryption protocol mostly based on AES algorithm so traffic between client and server could not be reverse-engineered and automated. To defend against abuse, there were also throttling services and honey-pot traps against bots. Anti-scraping mechanisms included rotating HTML schema (without an effect on user experience or functionality), in combination with detection of unusually high amount of requests that triggered responses with poisoned content.
How to structure your data analytics team
Tim Stobierski on the data-related roles and data strategy.
Modern CI is Too Complex and Misdirected
Gregory Szorc on distinction between systems for build and code integration.
The Analytics Hierarchy of Needs
Article The Analytics Hierarchy of Needs by Ryan Foley with great diagram:
What’s wrong with MLOps?
Laszlo Sragner on MLOps.
Potemkin Data Science
Blog post by Michael Correll:
2020
Test Pyramid
Martin Fowler on testing pyramid.
Java 8 code examples for the OCA exam
After doing a couple of mockup-exams, I realised that it is necessary to be familiar with a code that does compile, just as much as with code that does NOT compile. Following examples include both forms of code. Incorrect statements are commented out, and can be easily transformed back to code that throws compile-time errors.
The examples are not ordered in any way. They are just grouped by similarity (eg. arrays, flowcontrol, lambdas, exceptions, etc.)
One code example is not necessarily designed to explain only one thing; it can illustrate several syntactic or programming principles of Java language.
One example is not enough to explain or understand a principle: therefore, code contains seemingly redundant lines of code that nonetheless help in acquiring the pattern behind the particular case.
How to explain technical debt in plain English
Kevin Casey on technical debt.
Differentially Private SQL with Bounded User Contribution
Differential privacy in SQL
How to Move Beyond a Monolithic Data Lake to a Distributed Data Mesh
Zhamak Dehghani on data mesh.
2019
5 principles for cloud-native architecture
Five principles for cloud architecture by Google’s Tom Grey.
Testing in Production, the safe way
Story of testing in production environment by Cindy Sridharan.
A Brief History of Non-Relational Databases
Keith D. Foote on non-relational databases.
Anatomy of a Privacy-Safe Large-Scale Information Extraction System Over Email
Paper on Gmail’s data mining
Continuous Deployment at IMVU: Doing the impossible fifty times a day
Old blog post from 2009 by Timothy Fitz:
Perspectives on Research in Artificial Intelligence and Artificial General Intelligence Relevant to DoD
The report discusses the successes of reinforcement learning (RL, which can be applied both to DL and other paradigms); graphical and Bayes models, especially with probabilistic programming languages; generative models that may allow training with much smaller data sets; and other kinds of probabilistic models such as those that have shown remarkable successes in question answering (e.g., IBM’s Watson), machine translation, and robotics. While DL will certainly affect all of these fields, it is not the only or final answer. More likely, DL will become an essential building block in more complicated, hybrid AI architectures.
Munich Population with PowerBI
Visualization on Munich population grouped by districts.
Top 500 companies in Croatian IT - Superset
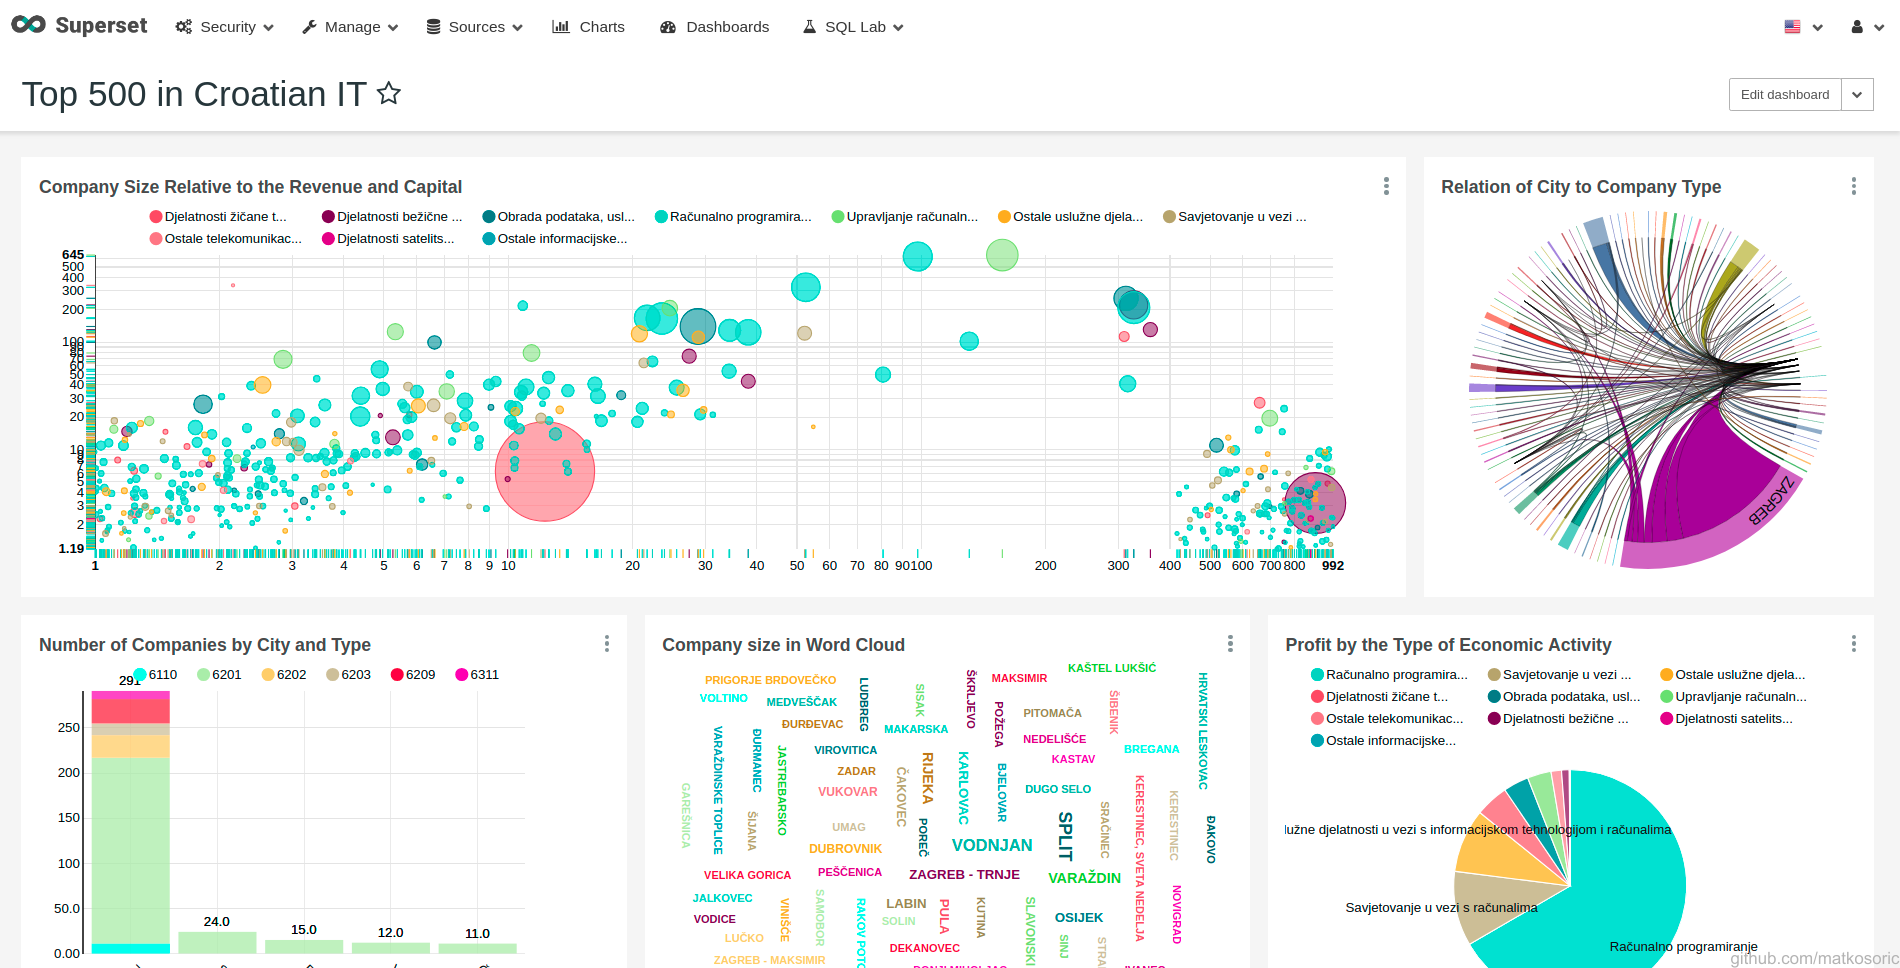
First image is a dashboard composed of all other figures. Second figure is a bar chart of companies grouped by city and activity. There is a clear domination of capital city (Zagreb) where are most of the companies registered. However, there is also a clear domination of 6201 code, which denotes ‘Computer programming’. Interestingly, other cities have companies only in this domain, and nothing in counseling(6202), wireless communication (6120), data analysis (6311), equipment management (6203), or even uncategorized activity (6209). Third image represents profit allocation with a pie chart. Roughly two thirds annual profits are from computer programming. Fourth image is a word cloud that counts employees in each city and presents them in adequate ratio. Clearly, Zagreb as a capital city with the most companies has the largest word size. Fifth is a chord diagram that connects company location with activity. Again, presence of Zagreb and programming is easily notceable. Sixth image is a bubble chart. Each data point represents one company. X axis is mapped to a value of ‘Capital and reserves’. Y axis is mapped to the annual revenue. Scales are logarithmically adjusted. Bubble size is linked to the number of employees in the company, while bubble color is linked to the activity type. Presence of red coloer indicated ‘Computer programming’ category. Big purple circle in the middle is Croatian Telecom (Hrvatski Telekom). Big bluish circle in the bottom right corner is VipNet. Since SuperSet reads these numbers as strings, ratios are not correct, and the same figure should be done properly with another tool.
Top 500 companies in Croatian IT - matplotlib
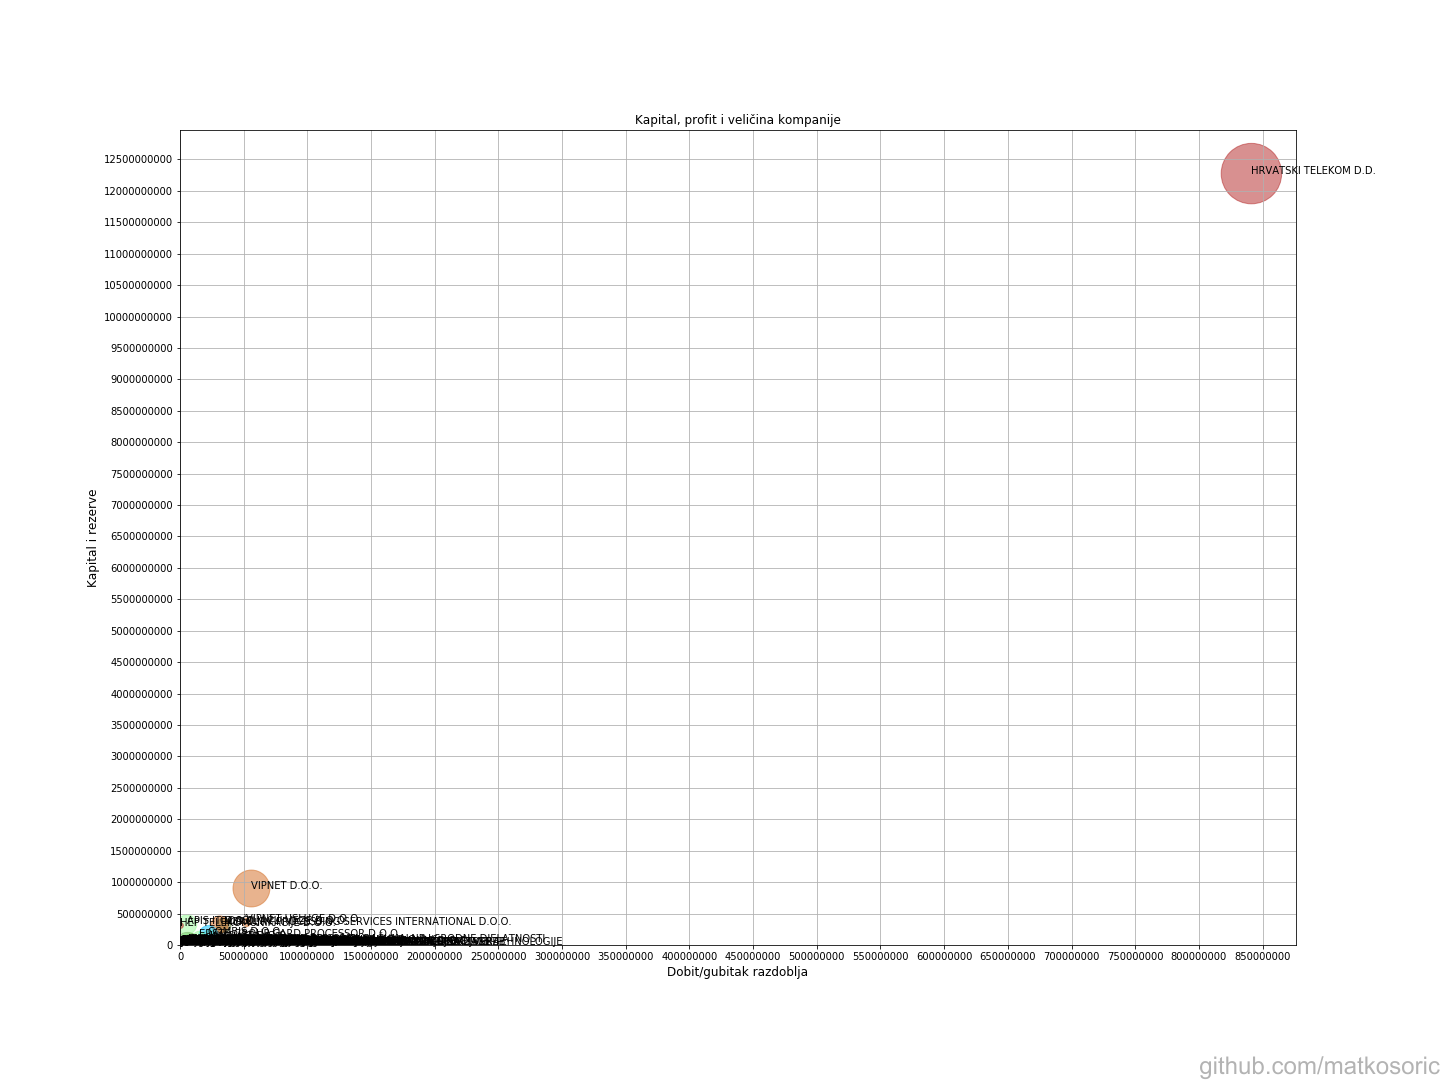
First five images are presenting relation of company’s capital to the annual profit, while simultaneously showing relations of company size and type of main economic activity. X axis is mapped to annual profit, Y axis is mapped to capital and reserves. Circle size is correlated to the number of employees, while circle color represents type of work in the IT sector, such as computer programming, counseling(6202), wireless communication (6120), data analysis (6311), equipment management (6203), or uncategorized activity (6209). First image clearly illustrates extremely dominating position of T-Com company. Following images are presenting the same data with different levels of zoom. Last figure is a bar chart, revealing Zagreb as a software center, and computer programming as a sole activity of companies in different cities.
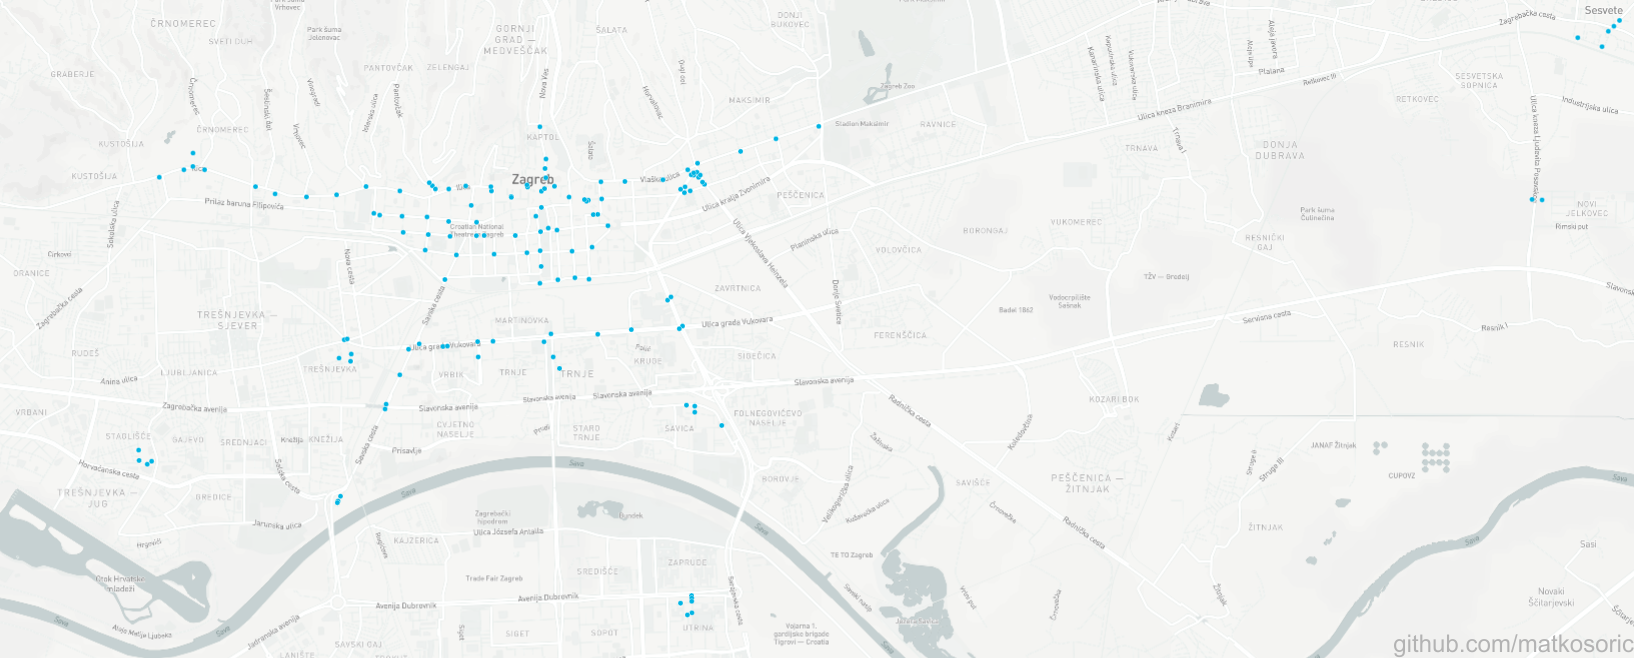
Compass and MongoDB with the Zagreb Surveillance Cameras dataset
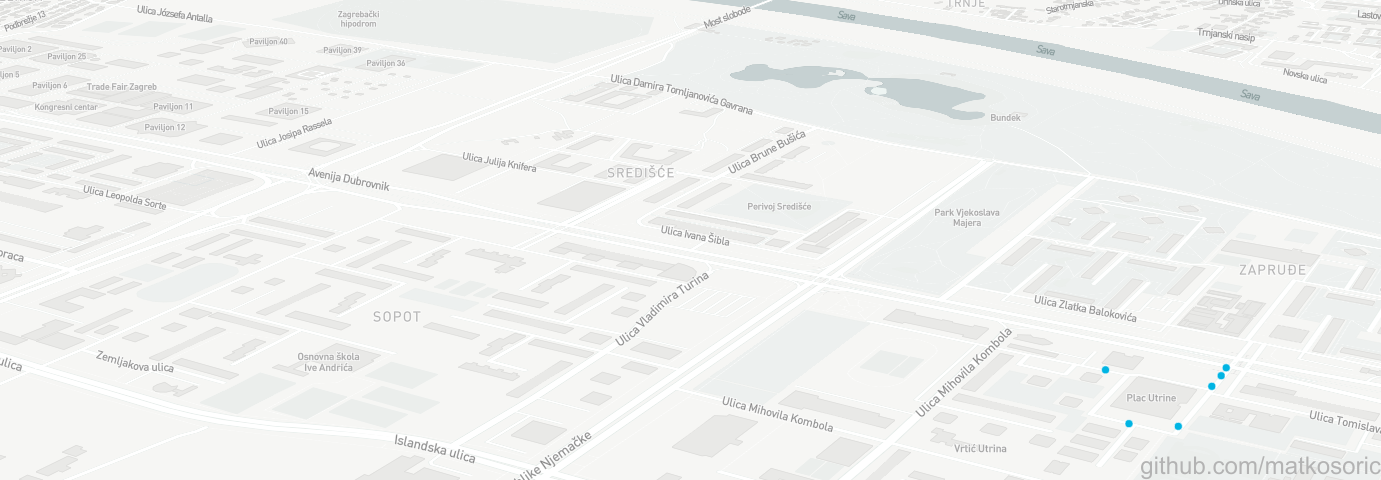
This is a demonstration of MongoDB’s Compass visualization capabilities with geographical data. The repository contains an original csv, a preprocessed csv, a gawk script for transforming csv to json, and finally json prepared for importing in MongoDB. The list is not updated, and new cameras have been installed after the publication of the dataset in 2016. The first image is a classical, ‘neutral’ view, encompassing all geolocations. Other images are zooming into particular part of the city while shifting angle.
Visualizing Geolocations in Italy using ELK stack
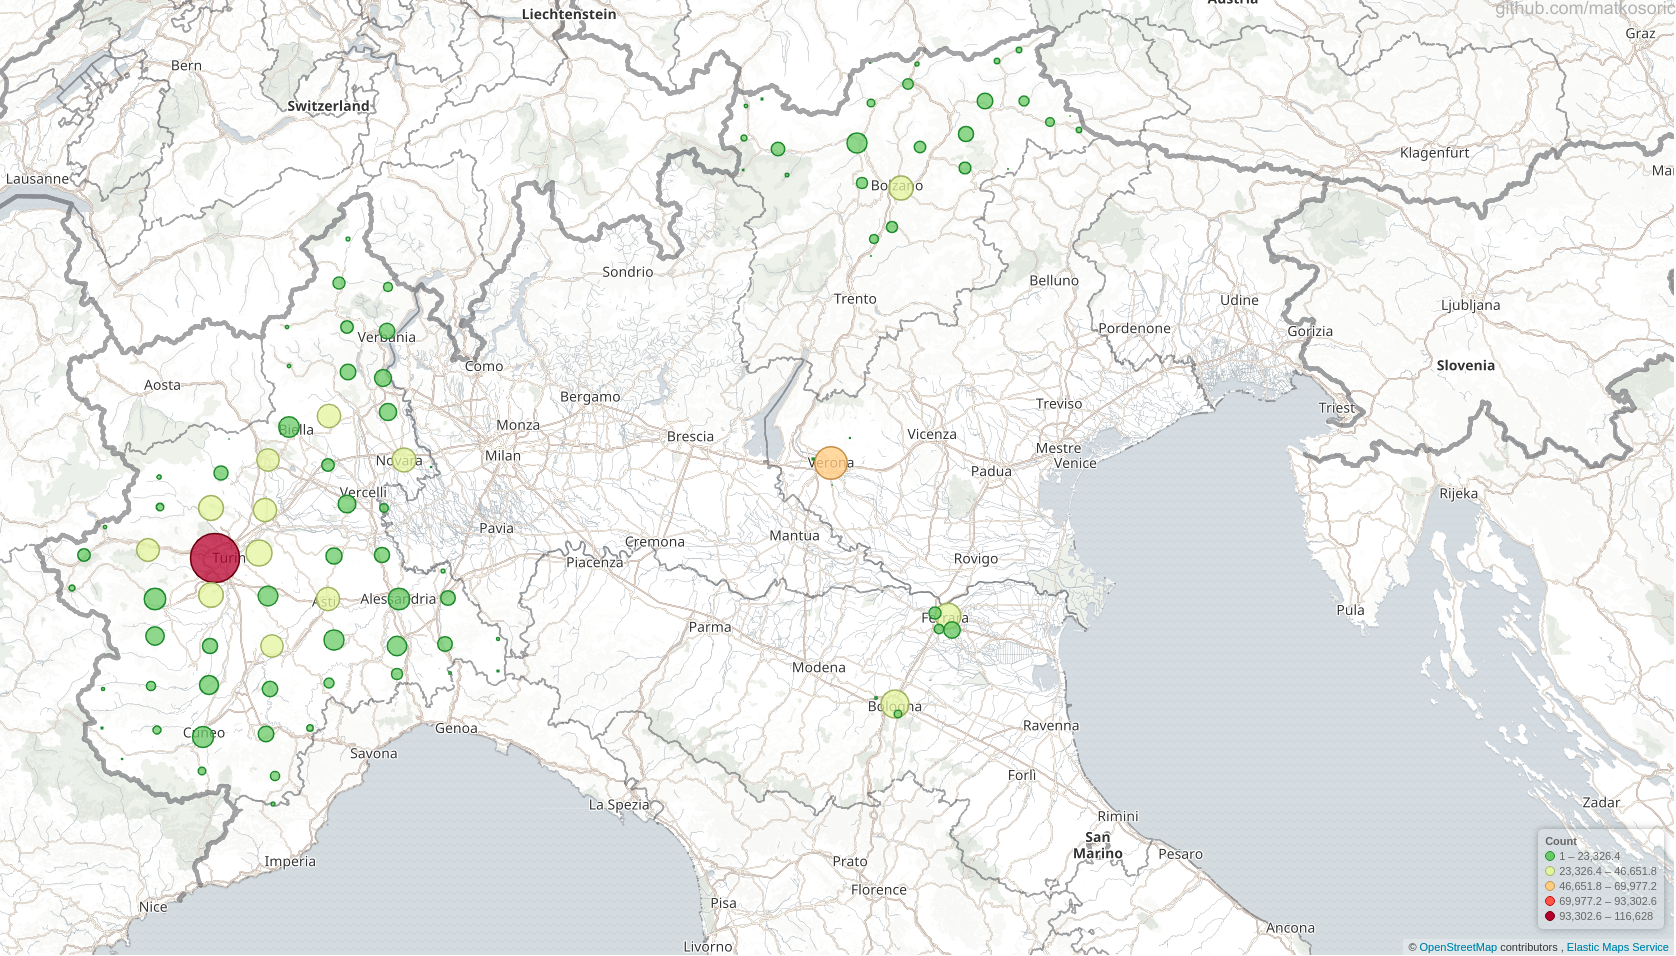
This is a demonstration of ELK stack geo-mapping capabilities.
The original Dataset
The presented data are a subset of geo points in a zip file for Europe (https://s3.amazonaws.com/data.openaddresses.io/openaddr-collected-europe.zip) available through the OpenAddresses project. I used only a couple of files related to Italy (ferrara.csv, bologna.csv, statewide.csv, etc.). Circle size and color are not related to any other features in a dataset; they simply indicate a quantity of points in a certain area.
Created With
- ElasticSearch - ElasticSearch NoSQL engine
- Kibana - Kibana visualization tool
- Logstash - Logstash ingestion tool
Visual Exploration of Croatian Literature Translations
This is a demonstration of ELK stack’s visualization capabilities. First figure is a smoothened area chart of translations through years, spiking in 2008, just before the economic crisis kicked in. Second visualization is a donut chart of translated authors, with Ivo Andrić being the most translated author (14.71%). Third image represents a bar chart of top Croatian literature translation publishers. Fourth figure is a donut chart of translations by language. German language dominates with 21.15%, followed by English (11.09%), Slovakian (10.62%), and Slovenian (9.04%). Figure five is identical to the previous figure, with added tabular info. Sixth figure represents an area figure of the number of translations grouped by country. Germany leads with over 300 published items. Seventh visualization is a pie chart of the most commonly translated titles. First place is taken by “Na Drini ćuprija” (9.1%), written by Ivo Andrić.
Figures from Steven Pinker’s book The Better Angels of Our Nature
Here are several visualizations about violence rates created with R.
Several percentages in a figure about a share of violent deaths are referencing only male population; to simplify, I neglected that information.
Third figure illustrates the ‘Recivilization of the 1990s’ thesis, a period of violence decline. Pinker claims it is due to the increased incarceration: “The most effective was also the crudest: putting more men behind bars for longer stretches of time.”; and increase in the police force: “In a stroke of political genius, President Bill Clinton undercut his conservative opponents in 1994 by supporting legislation that promised to add 100,000 officers to the nation’s police forces.”, among other things.
Fourth figure is adopted to the time scale of century instead of mid year, and the conflicts are ordered.
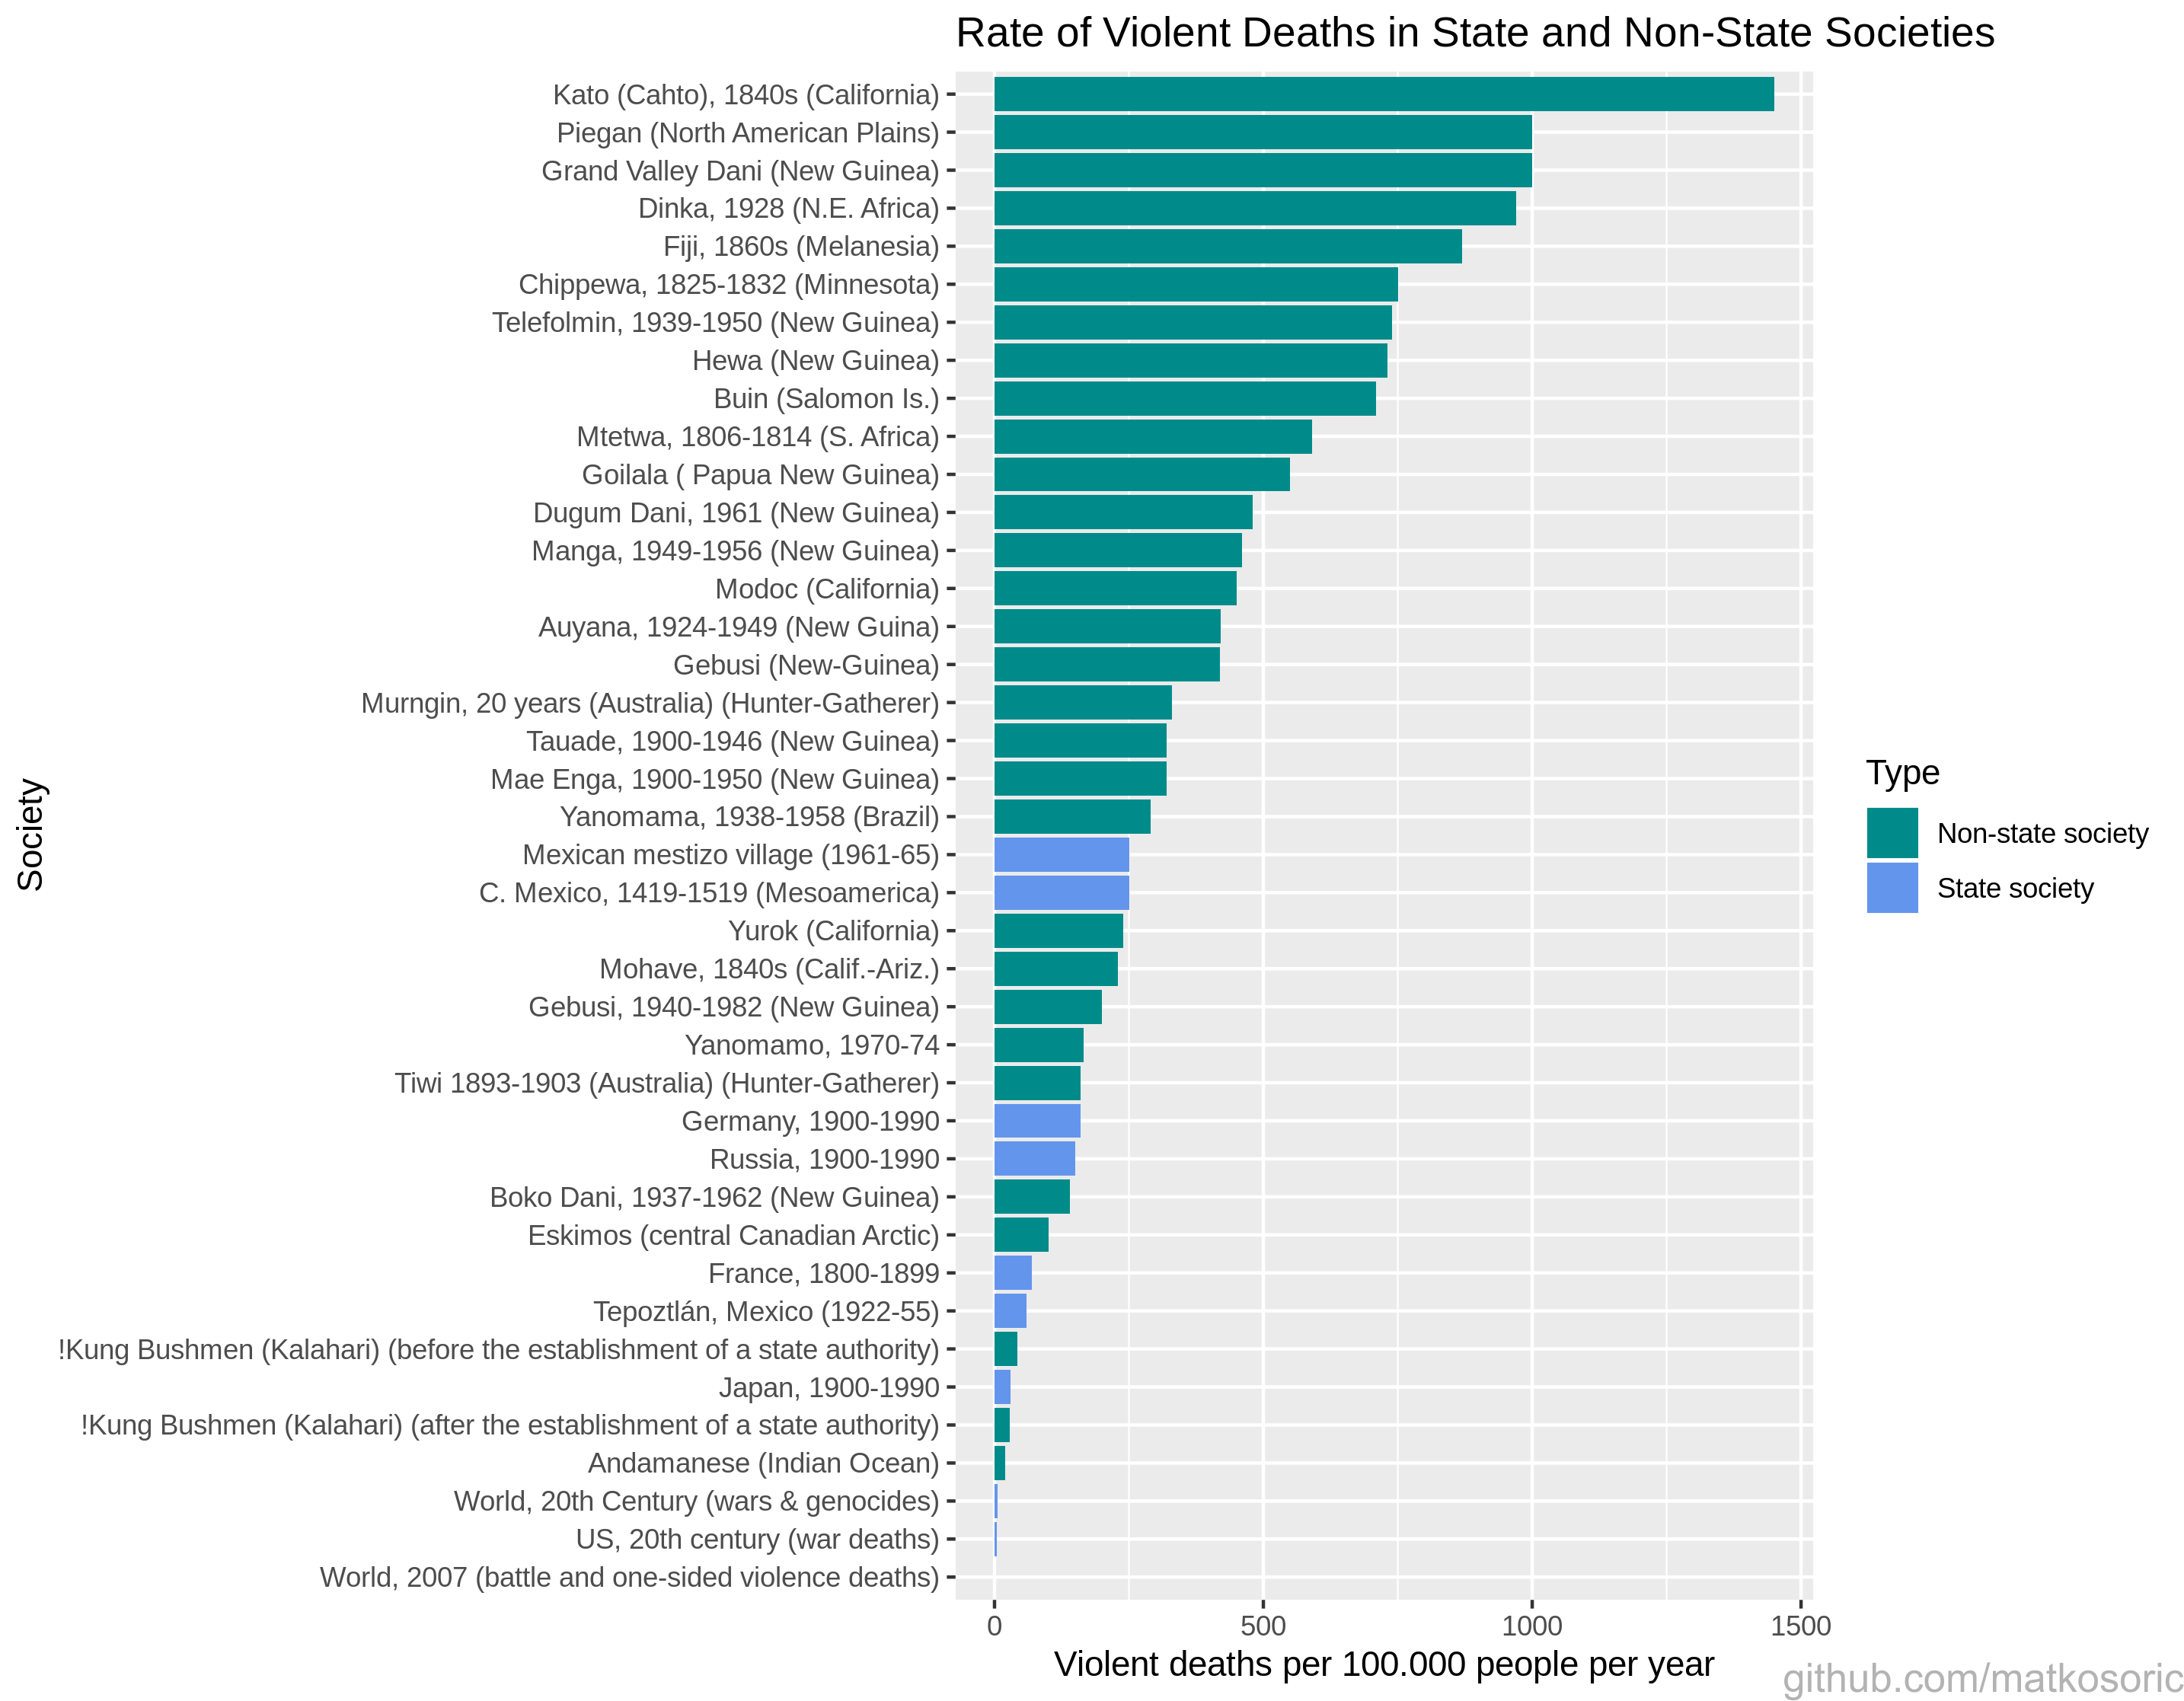
Steven Pinker’s book: The Better Angels of Our Nature
Croatian Language Dataset
This is a dataset of sentences in Croatian language for anyone interested in Natural Language Processing. The dataset is Spark’s dataframe in a snappy compressed ORC format. Most of the sentences are from the Croatian Wikipedia dump and OpenSubtitles project. There are still entries that do not belong here, whether in a form of misspelled or grammatically incorrect sentences, logs, different languages, or weird tags. However, those should be minimal. The goal of this project was to create a reusable dataset with standardised use of Croatian language for various purposes.
Size
- 14.7 million entries
- 840 mb uncompressed size
- 460 mb snappy compressed ORC
Netflix Recommendation Model

Netflix prize was an open competition for the best collaborative filtering algorithm, which started in 2006. BellKor’s Pragmatic Chaos team from AT&T Labs won the prize back in 2009. This Spark application will use Spark’s 2.4 built-in ALS algorithm to create a recommendation model for the data set from the competition.
2018
Functional Data Engineering
Maxime Beauchemin, creator of Airflow, advocating application of functional programming principles to data engineering.
Lessons Netflix Learned from the AWS Outage
Article by Adrian Cockroft, Cory Hicks, and Greg Orzell from Netflix and its resiliency. Here are a couple of important points:
What is Continuous Delivery?
Pretty good definition of continuous delivery:
The 10 commandments of logging
List of logging advices by Brice Figureau:
Blameless PostMortems and a Just Culture
Article by John Allspaw on Blameless Postmortems in Etsy with key takeaway:
Google Is 2 Billion Lines of Code—And It’s All in One Place
Article in Wired magazine about Google’s massive mono repo.
2017
Deploy != Release
Article by Art Gillespie on ambiguous terminology in CICD process. Although I prefer the meaning of Humble and Farley for “release” as in “an artifact of build process which can be deployed on demand”, the article is a worthwhile read nonetheless.
Goods: Organizing Google’s Datasets
The current catalog indexes over 26 billion datasets even though it includes only those datasets whose access permissions make them readable by all Google engineers.
Pair Programming vs. Code Reviews
Article by Jeff Atwood on Pair programming and code reviews with conclusion:
A Fully Homomorphic Encryption Scheme
PhD thesis by Craig Gentry on homomorphic encryption:
Building and testing at Facebook
Article by Andrew Bosworth from Facebook on rolling out new features and testing:
2016
Data Vault 2.0 Modeling Basics
Introduction to Data Vault 2.0 modelling, by Kent Graziano
Just Say No to More End-to-End Tests
Mike Wacker on Google’s testing strategy.
Robustness in Complex Systems
Paper about robustness and fragility of software systems by Steven Gribble:
2015
Link to PhD thesis entry
My philosophy PhD thesis in national bibliographic catalog.

